
This is a tool to visualize data from the Website of the 1. Österreichische Judo Bundesliga from the years 2011-2017.
As our project needs a database for filtering with SQL, it needs to run on a ApacheWebserver. Or you take a look at our self-hosted version:
The source code can be found under src or on our Github repository.
If you want to run it on your computer you need to do the following steps:
Alternativly in step 2 to the sql file you can use our Java Importer to import the data from the text files in src/results into your Database. Just open the IntelliJ Project in src/Database Importer/Visu2Project and (in the project) modify the file src/main/resources/hibernate-webdatabase.cfg.xml to fit your database.
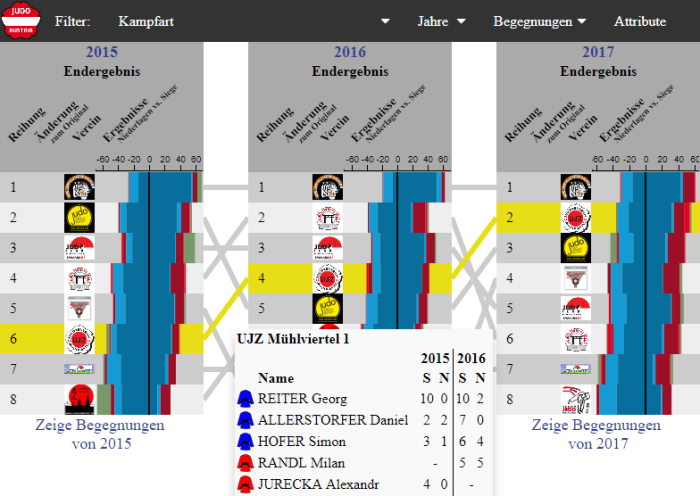
We used LineUp: Visual Analysis of Multi-Attribute Rankings from Gratzl et al. [1] as basis for our visualisation and we adapted it to fit our data. The rankings can be viewed per year or per rounds of one year. We use Stack Barcharts to visualise the accumulation wins and defeats for each fight from each club (accumulated by years and for each round separtly). Between rankings of different years/rounds we use linecharts to show the changes in the ranking of the different clubs. For the stacked bar charts and the linechart is a detail-on-demand tooltip implemented. The main idea of Gratzl et al. [1] was to allow to change the weight of attributes contributing to the ranking. Like in the paper we allow to filter the used attributes (different types of fights: "Stammkämpfer vs. Lizenzkämpfer", etc.) for calculation the ranking, but in contrast to the paper changing the weight of attributes doesn't make sense on our data (all wins are weighted equal). Therefore they can be either be weighted 0 (excluded) or 1 (included). To compare the results of filtering we provide indicators of the weight changes.
[1] Samuel Gratzl, Alexander Lex, Nils Gehlenborg, Hanspeter Pfister, Marc Streit; LineUp: Visual Analysis of Multi-Attribute Rankings; IEEE Transactions on Visualization and Computer Graphics (InfoVis '13), 19(12), pp. 2277–2286, doi:10.1109/TVCG.2013.173, 2013.
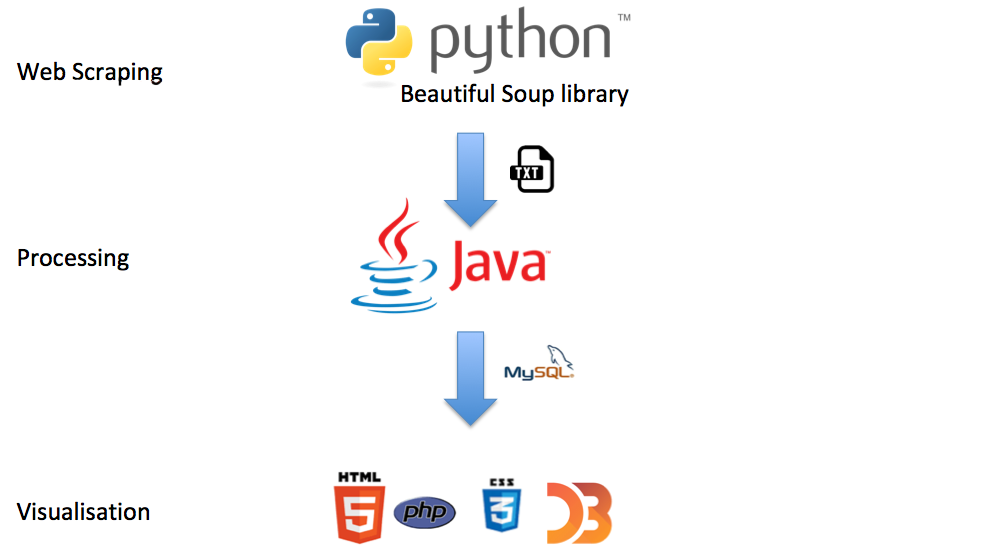
In the scraping step we extract the data from the official Judo Bundesliga webpage and save it as text file. The source code can be found under src/Scraper scrapted files can be found under: src/results
Used resources:
In this step we open the text files, process the into a form that suits us for the visualization and save them into a database.
This and the previous step can left out, if you use our provided sql file (src/judobl.sql) already containing all the processed data and import it into your database.