Motif Simplification: Improving Network Visualization Readability with Fan, Connector and Clique Glyps
The paper of Dunne and Shneiderman [1] describes a technique to compute understandable
networks visualizations which make it easier to extract structures and meaningful
information.
The technique is called motif simplifcation and its aim is to automatically replace
common network structures, called motifs, with glyphs. In their paper they focus on the
design and implementation of three motifs and glyphs.
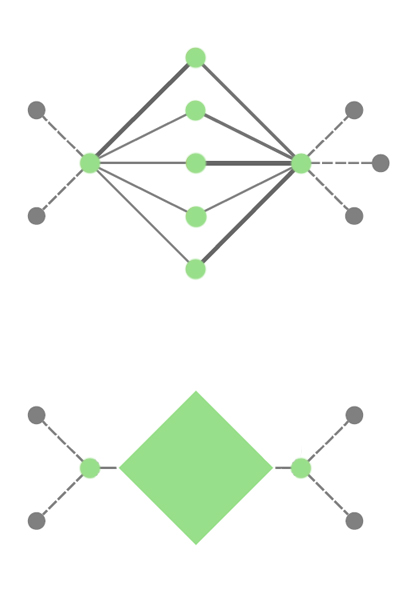
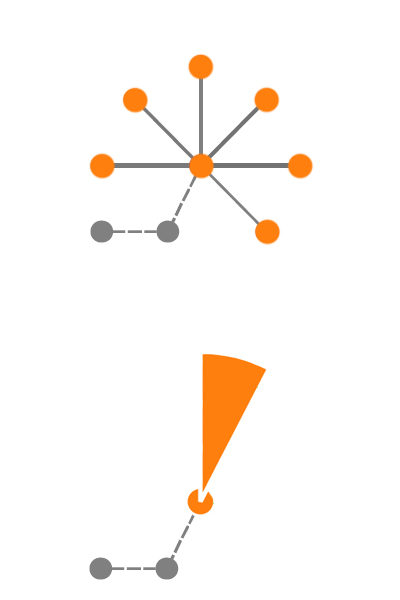
A fan represents a head node connected to multiple leaf nodes. The D-connector structure
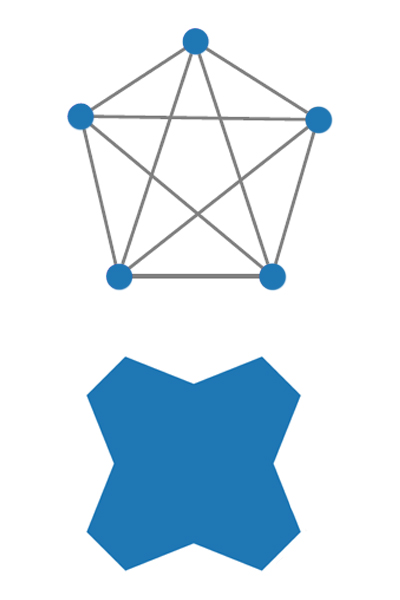
consists of span nodes which only connect a set of D anchor nodes and the D-clique
is a set of D nodes, where each node is connected to every other node of the set at least
once.
Their goal is to benefit from properties of well designed glyphs. They require less
screen space, make the network easier to understand, make relationships visible and
preserve as much information as possible.
Implementation
We implemented a web application using the javascript framework D3.js. This
library makes it easy to create information visualizations, as it allows easy
manipulation of svg-graphics and has a lot of useful features. In our web application
the user can select one of various data sets, which will then be visualized as a
node-link diagram.
For the detection of D-cliques we used the graph library JSNetworkX. The detection
algorithms for fans and D-connectors were implemented by ourselves according to the
pseudo-code in [1].
Our visualization of these motifs can be seen in the images below.
The front-end was designed using the Bootstrap library.
The target platform of our application are the most used browsers on the PC. We
did not focus on the support of mobile devices.
We found various suitable datasets in json- or graphml-format. For example:
Characters of "Les Miserables" [2], Wikipedia users [3], "Game of Thrones" characters
[4], TU courses.
Clique
Connector
Fan
Interaction
In the sidebar on the left, the user can select one of the provided datasets to
visualize. If available, the attribute according to which the nodes should be colored
can be selected.
Additionally the grouping of motifs is done in the sidebar. Different combinations of
groupings can be selected. For the cliques and connectors the user can select the number
of nodes which may be collapsed into a glyph, where a clique needs to have at least 4
nodes and a connector at least 2.
On the right side is a collapsable sidebar showing the legend of the coloring of the
nodes and a panel to interact with the collapsed motifs. By hovering over a motif
descriptor in the sidebar, the corresponding glyph in the network is emphasized.
Clicking such a descriptor toggles the visualization of this motif between the glyph and
the underlying nodes.
Interaction with the network can be obtained by clicking and dragging at the svg and
nodes, zooming is possible using the mouse wheel.
When hovering over nodes, their corresponding names are displayed
References:
[1] Cody Dunne and Ben Shneiderman. Motif simplification: Improving network visualization
readability with fan, connector, and clique glyphs. In Proceedings of the SIGCHI
Conference on Human Factors in Computing Systems, CHI '13, pages 3247-3256, New York,
NY, USA, 2013. ACM.
[2] Jim Vallandingham. Flowingdata - how to make an interac-
tive network visualization. http://flowingdata.com/2012/08/02/
how-to-make-an-interactive-network-visualization/, last accessed: 5th
April 2018.
[3] Paolo Massa. Social networks of wikipedia. http://sonetlab.fbk.eu/data/
social_networks_of_wikipedia/, last accessed: 5th April 2018, 2011.
[4] Graph drawing 2018. http://graphdrawing.de/contest2018/topics.html, last
accessed: 5th April 2018.