Visualizing Data using t-SNE
Paper implementation of Visualisierung 2 course
- Paper Title: Visualizing Data using t-SNE
- Paper Link: https://lvdmaaten.github.io/publications/papers/JMLR_2008.pdf
- Student: Lisa Kellner (1428183)
Short Paper Summary#back to top
The t-SNE algorithm visualizes high-dimensional data by two- or three-dimensional points where as much of the significant structure of the original data is preserved in the low-dimensional representation. With this technique, similar objects in high-dimensional data space are represented by spatially close points and divergent data by distant points. So not only the local structure of the high-dimensional data is retained, but also the global structure which reveals possible clusters in the data. The basis of t-SNE is the Stochastic Neighbor Embedding (SNE) introduced by Hinton and Roweis but with an easier optimization approach and avoidance of crowding points together in the center.
Implementation Summary#back to top
The t-SNE algorithm is a functional implementation in F# in combination with the open source
Aardvark platform developed by the
VRVis Research Center. The Aardvark platform is a collection
of algorithms and data structures for computer graphics and visualization with its own rendering
engine. But the visualization is a simple interactive scatter plot embedded html-side done
with Highcharts. The scatter plot can easily be saved as an image via the webside.
The outcome of the implementation is a simple command line tool which takes the input file,
a destination path for the resulting webside and an optional title for the plot, like for example:
tSNE -csv C:\tSNE\data.csv -o C:\tSNE\result.html -t pageTitle
Source Code#back to top
The program is written in F# using Visual Studio 2017. The whole solution can be found in
src-folder of the submission. To compile the solution and download all necessary dlls you have
to run the build.cmd first (simply double-click on it). Then you can open the
Visual Studio solution in the src-folder.Or you can start the prebuild command line tool by executing the tSNE.exe in the bin-folder of the submission.
The documentation of the source code can be found here.
How to run the cmd tool#back to top
The command line tool takes 3 input arguments:
tSNE -csv input_csv_file -o output_path_of_html [-t chart_title]
Where the -t parameter for the chart title is optional. If no title is given
the program simply unses the filename. The output path has to be an (not yet existing)
html-file.The input file is a csv-file with the following layout:
                                    class,val1,val2
                                    red,1,1
                                    red,2,2
                                    blue,3,3
                                    blue,4,4
Note: The first row contains the headers and the first header have to be "class"!The resulting chart can be saved as an image via the website.
Results#back to top
Note: Click on the images to open the resulting interactive websites!Akaze Features of Buildings
This dataset was provided by the VRVis Research Center and its representing labeled Akaze features from buildings.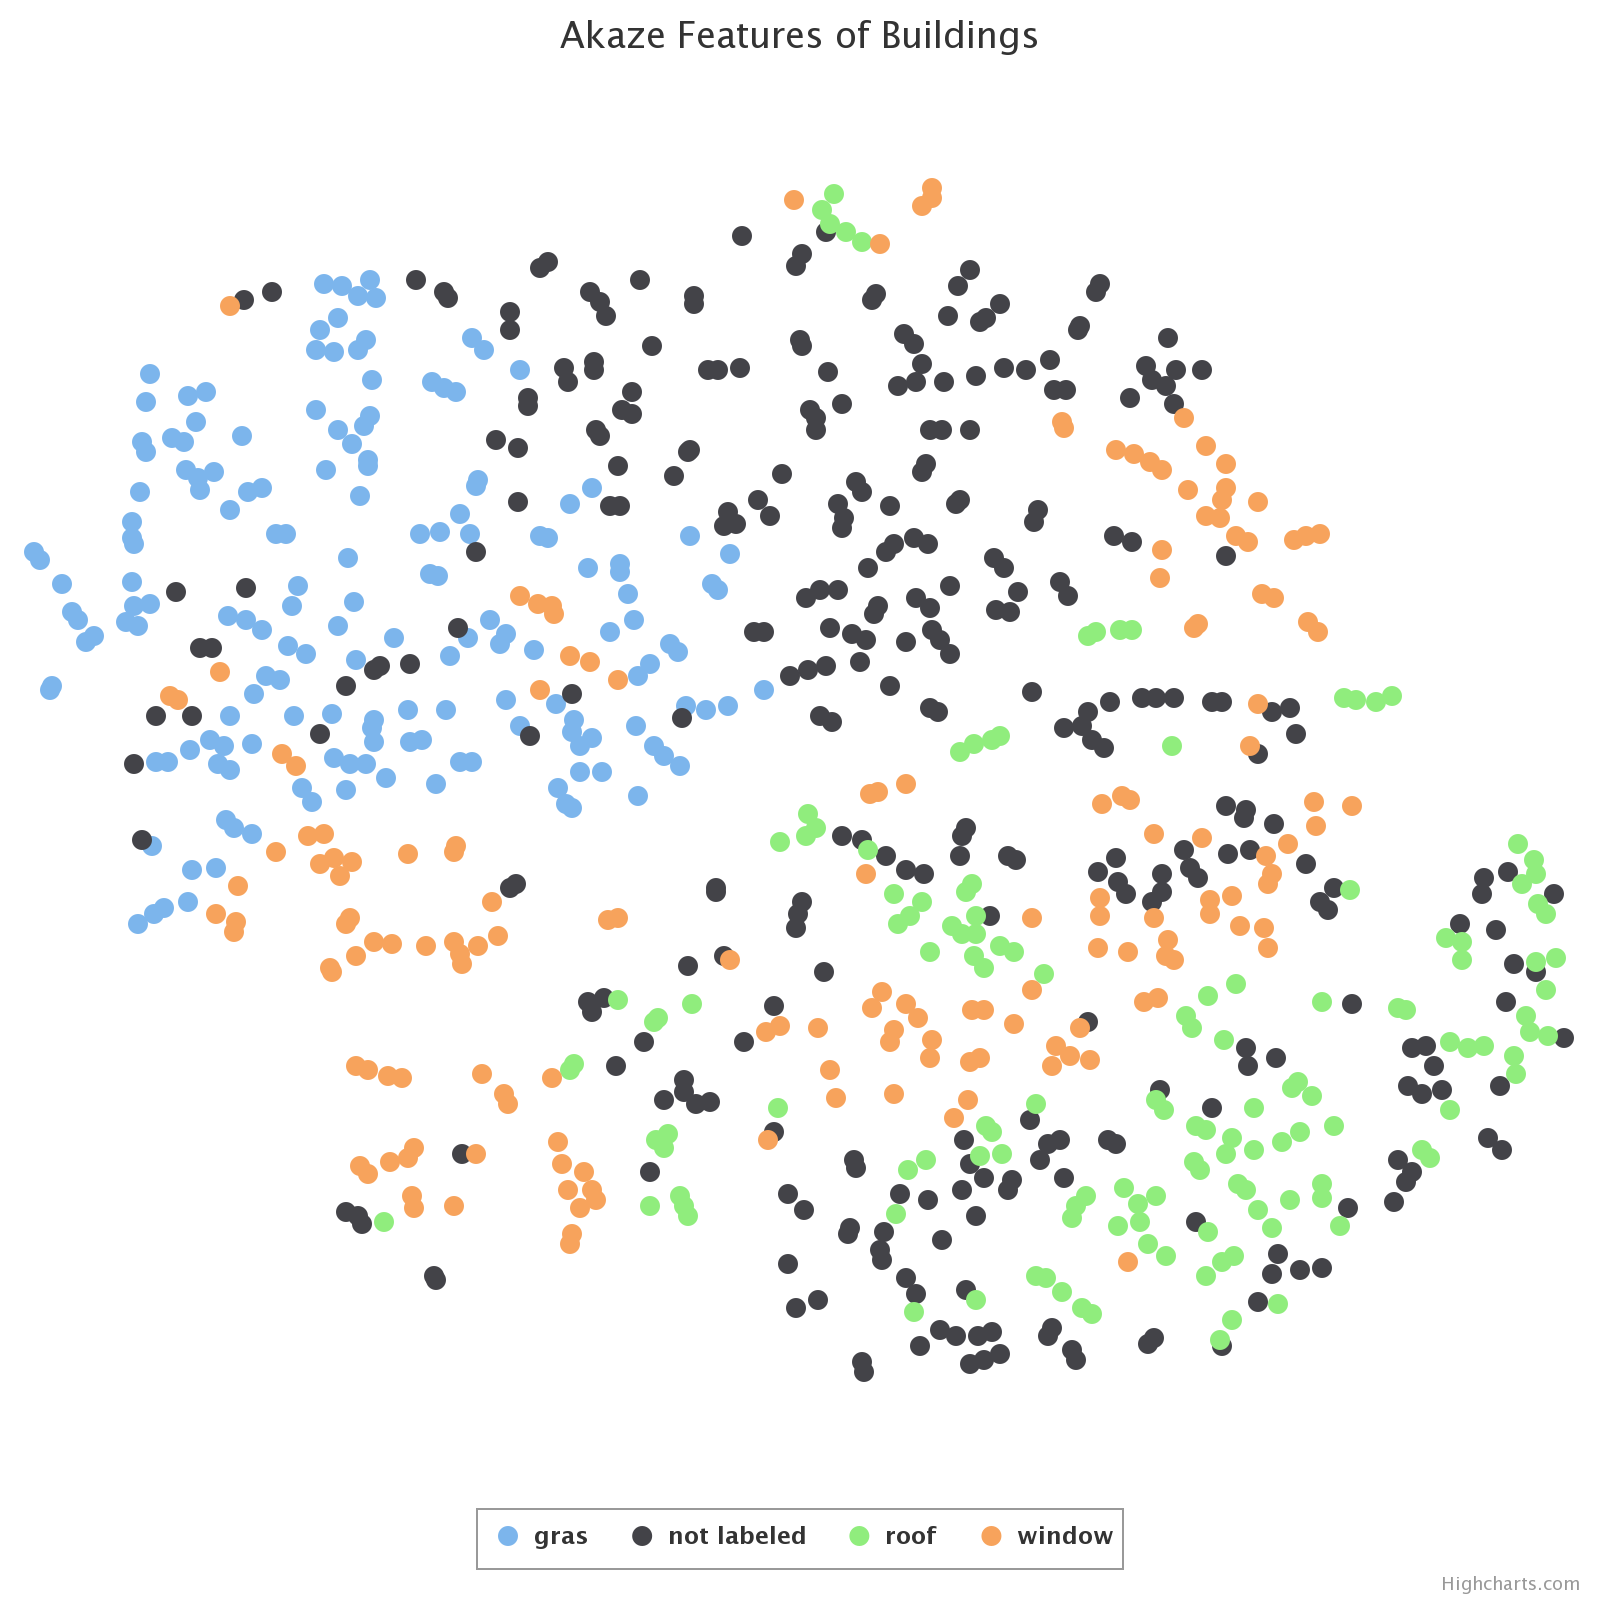
MNIST dataset
The MNIST dataset represents handwritten digits from 1 to 10. Here a fewer amount of data samples was taken than in the paper.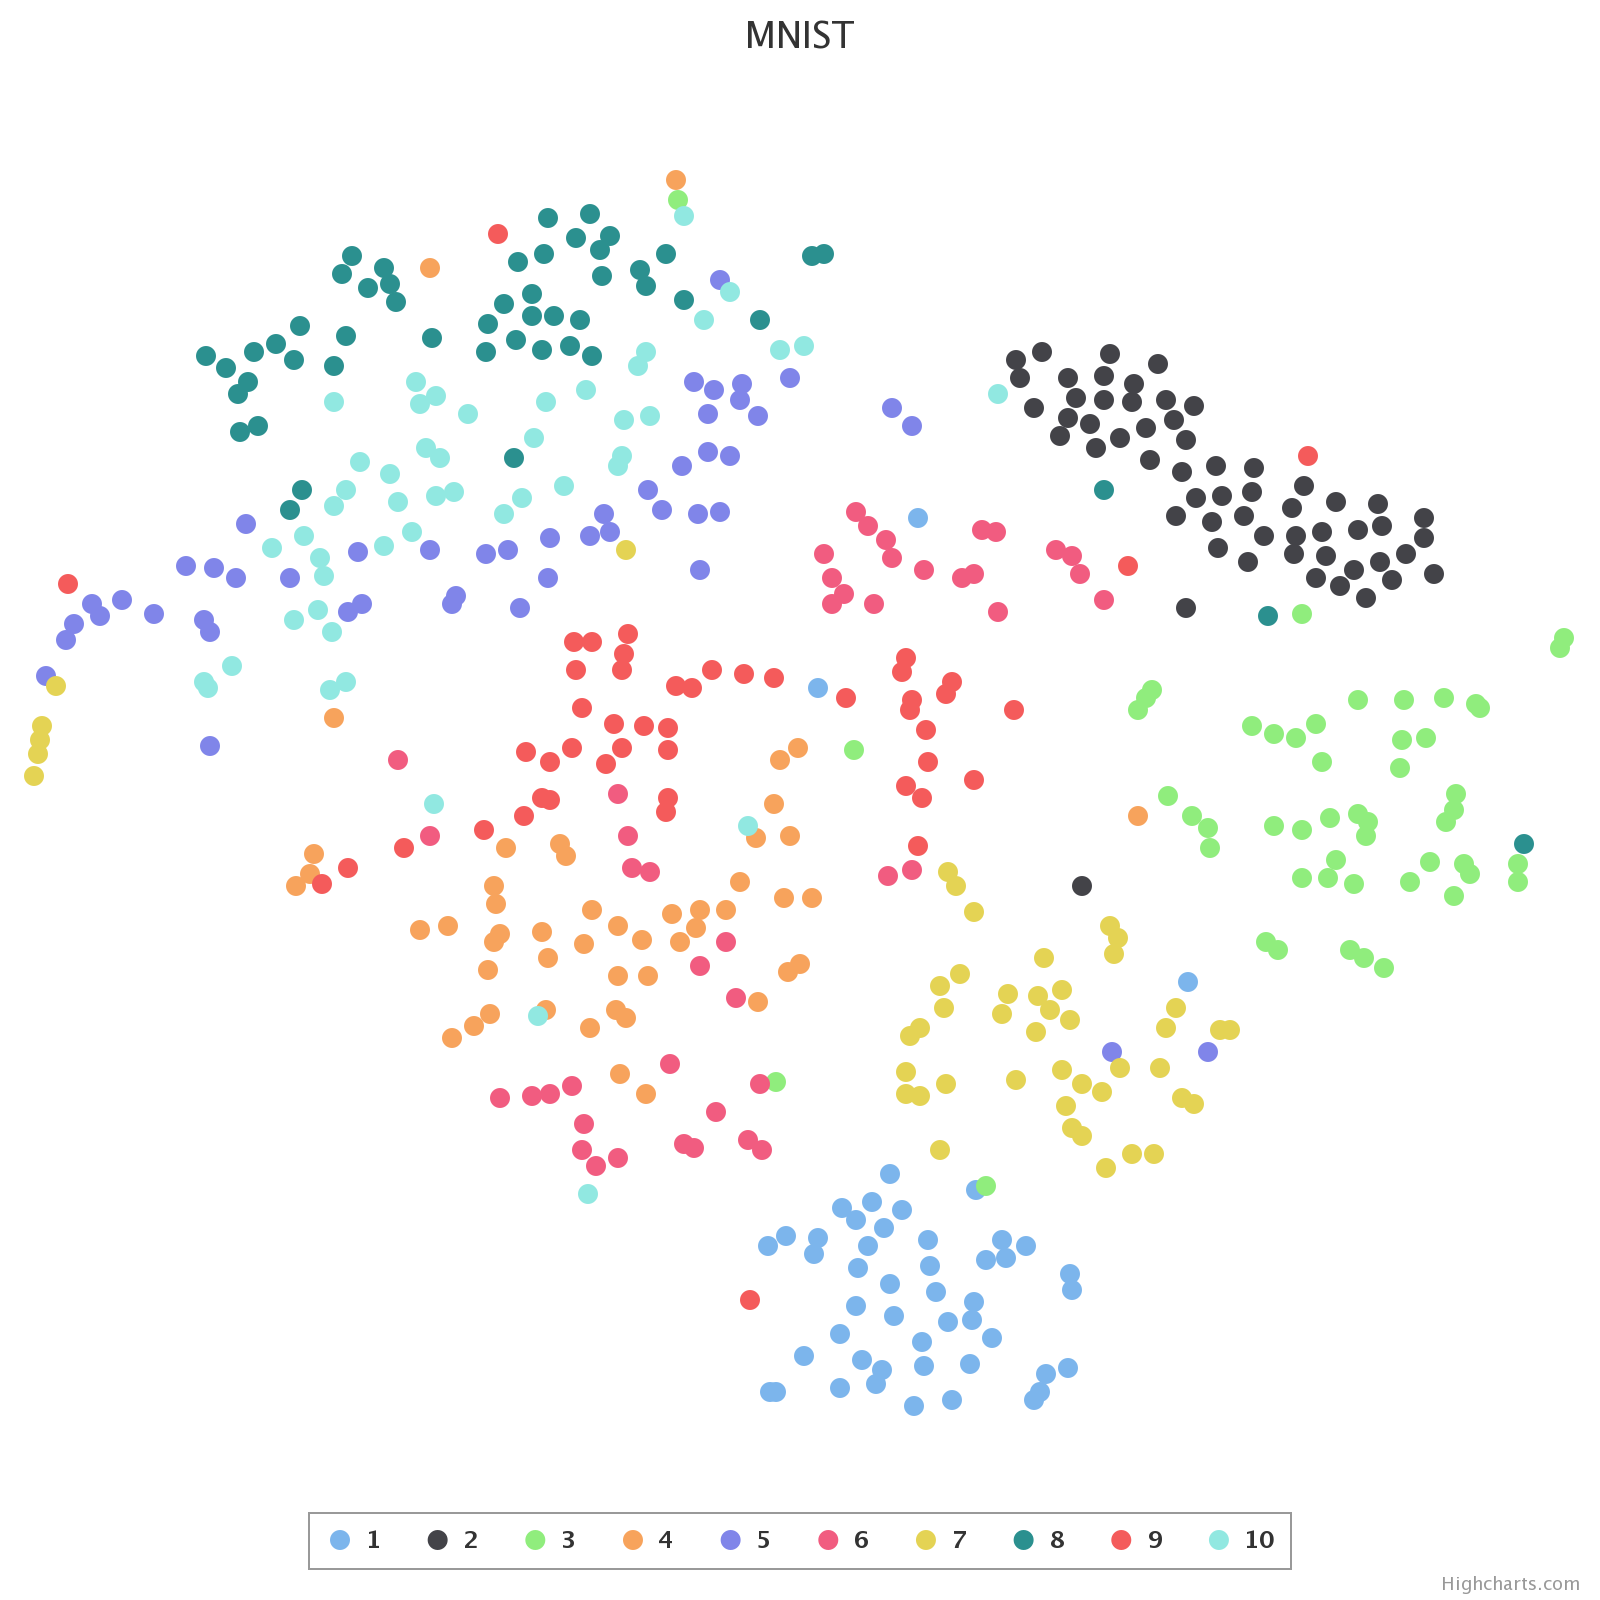
COIL-20 dataset
The COIL-20 dataset are features of b/w images which represents different objects (like a piggybank).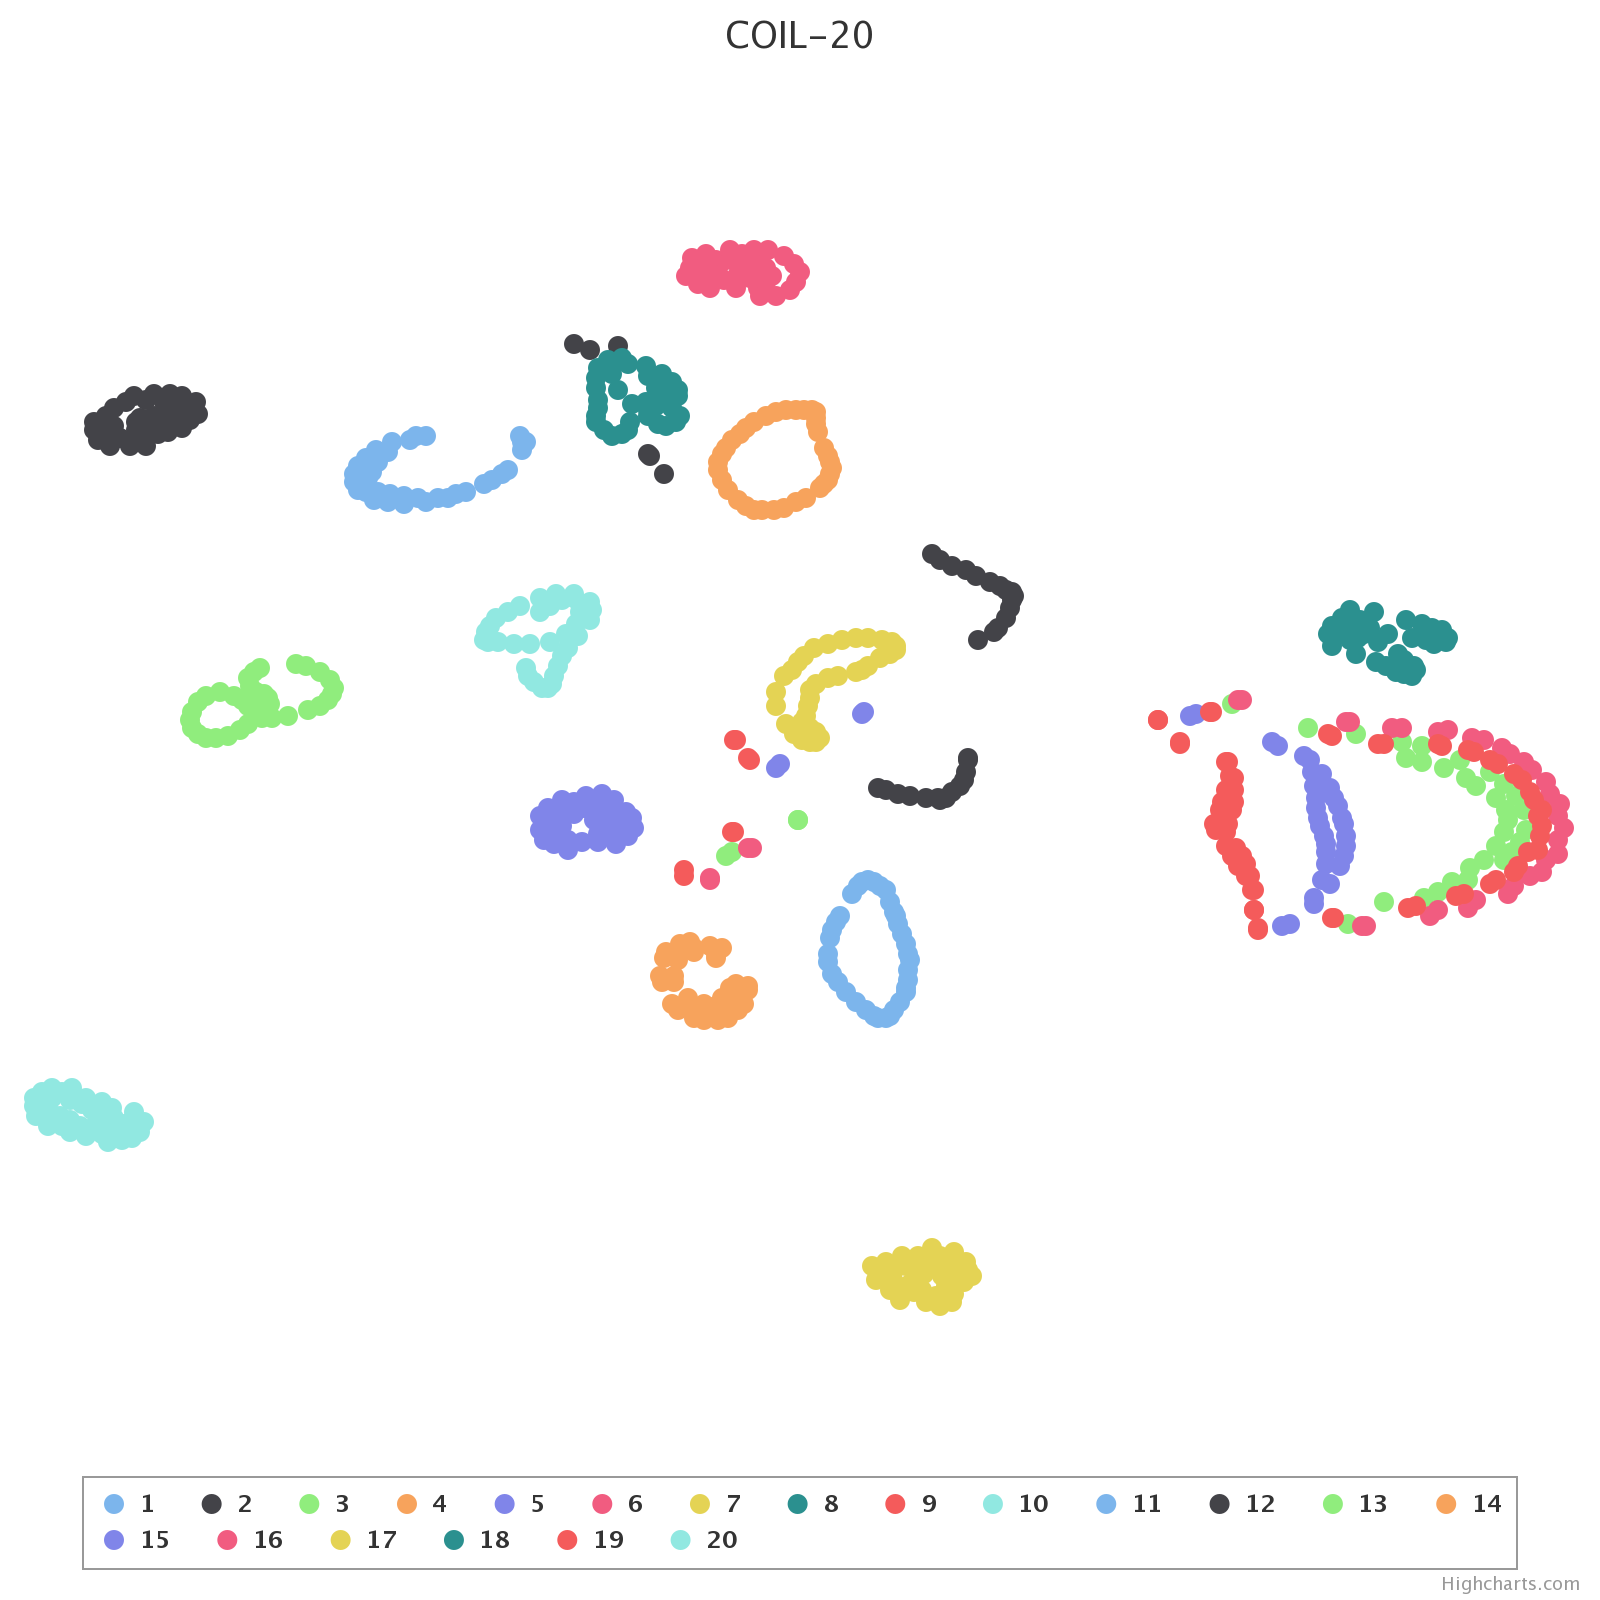
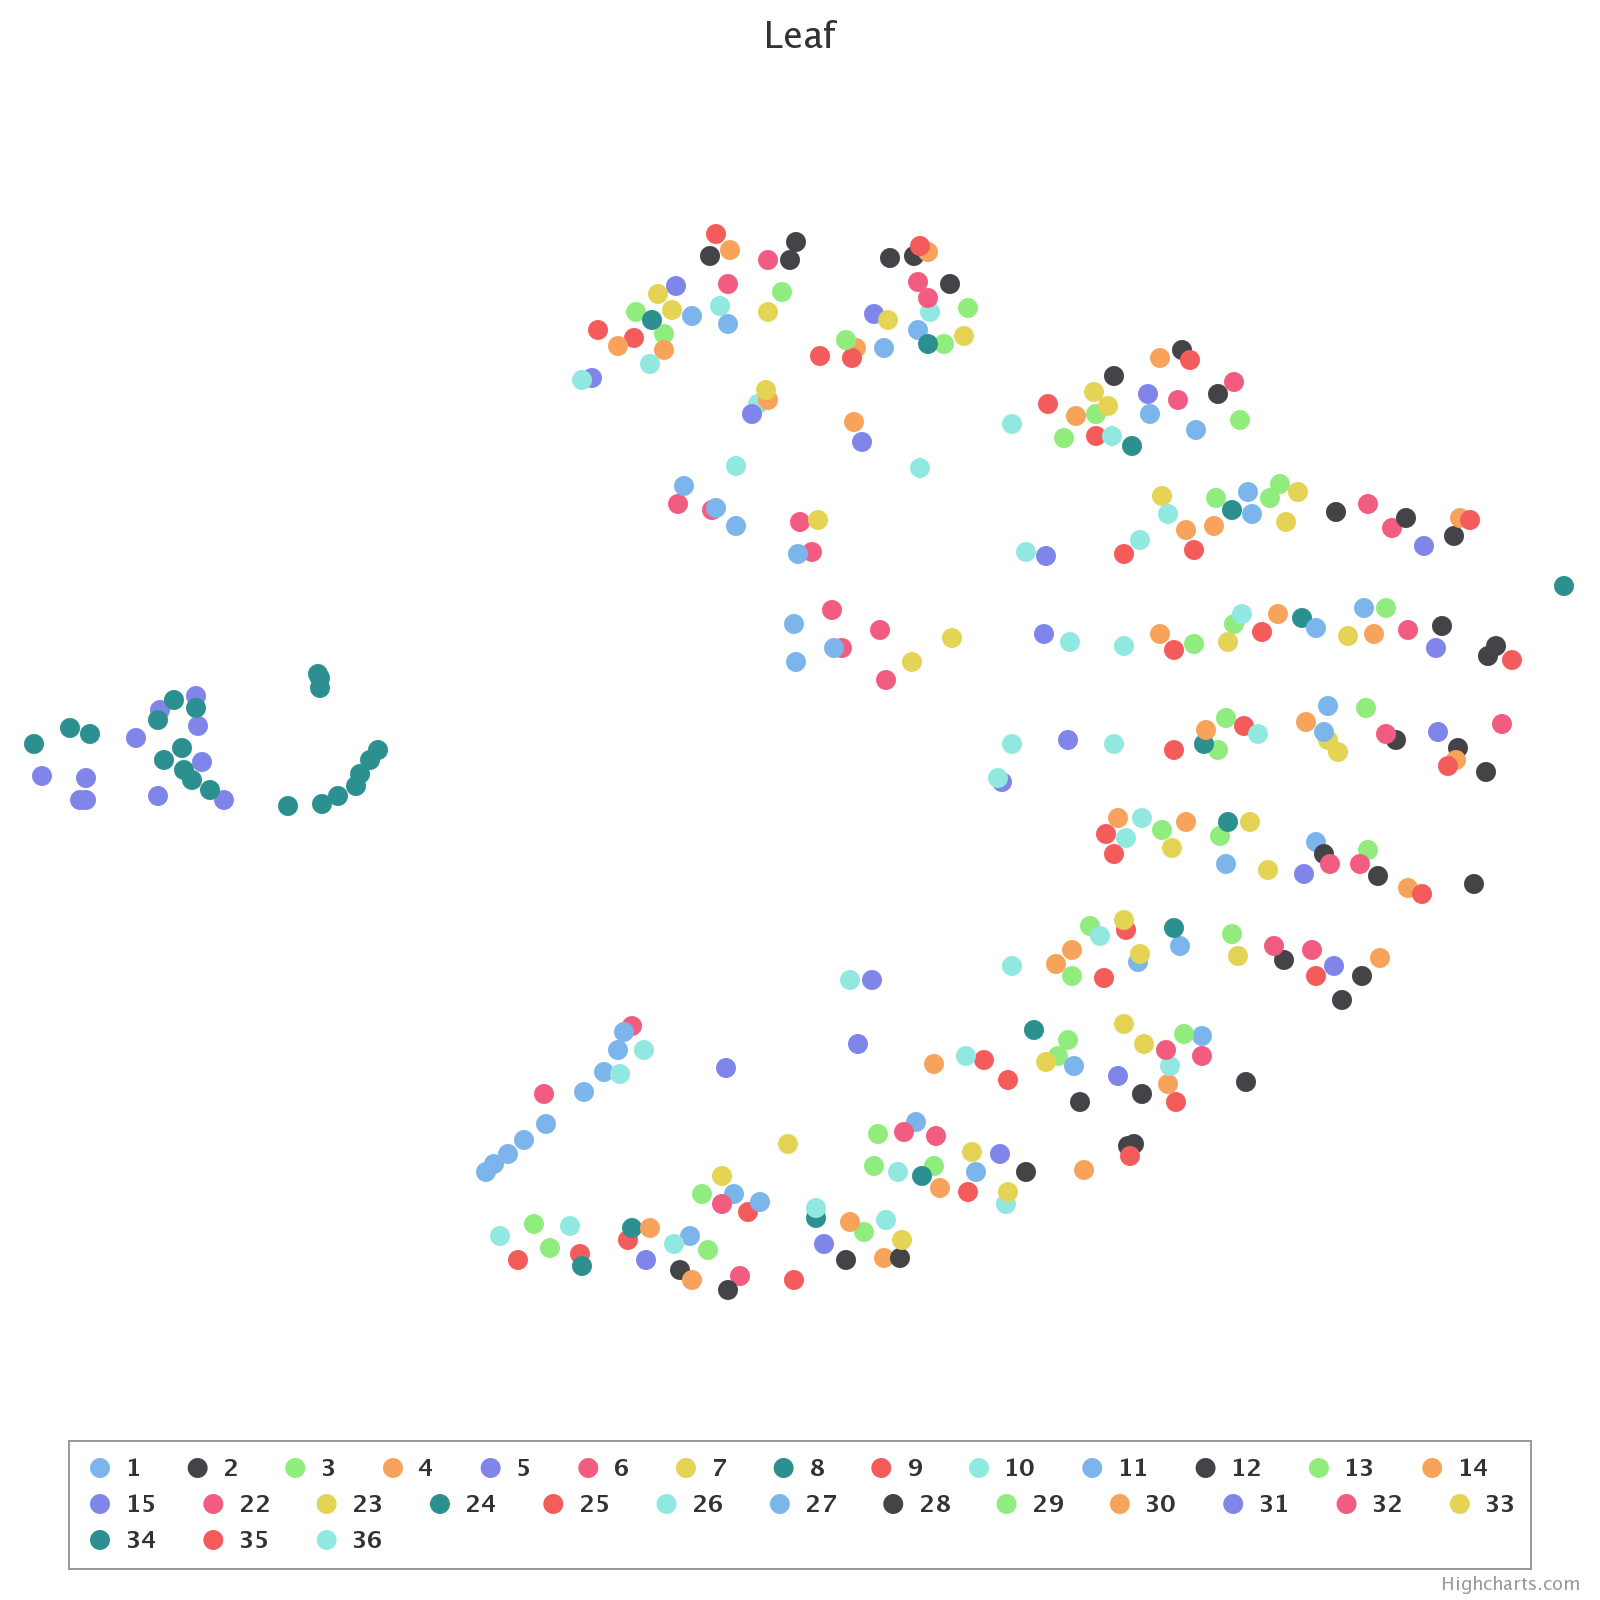
Leaf dataset
The Leaf dataset is describing leaves with 15 different features, like the asprect ratio or convexity.