Gruendl et al.: Time-Series Plots Integrated in Parallel-Coordinates Displays
reimplemented by: Robert Glanz and Manuel Mayerhofer
Description
Paper description
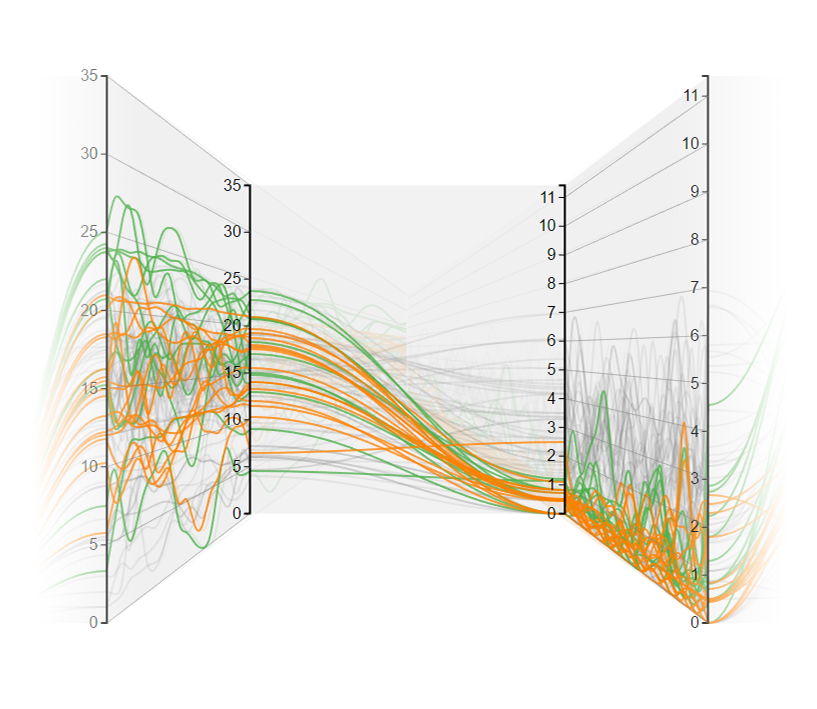
Gruendl et al. extends the two dimensional Parallel Coordinate Plot with a third dimension. The third dimension is intended to visualize the temporal components of temporal multivariate data. A three-dimensional object is created in which the x-y plane is parallel to the parallel coordinate diagram and the time is along the z-axis. Considering only the x-z intersection, you obtain a time series of the particular attribute. A vanishing point widget was developed to get this time series. This widget integrates time series between two adjacent axes by using a vanishing point. The widget is disabled by default and can be activated on multiple axes. Generally only one time stamp is displayed on the parallel coordinates without the widget. The time can be set with a global slider or for each axis with a local slider. It is also possible to move several axes at the same time simultaneously.
Dataset
This dataset represents a real-life benchmark in the area of Activity Recognition applications.The classification tasks consist in predicting the activity performed by the user from time-series generated by a Wireless Sensor Network, according to the EvAAL competition technical annex. It have a epoch time of 250 milliseconds according to the EVAAL technical annex. There are 5 samples of RSS for each of the three couples of WSN nodes (i.e. Chest-Right Ankle, Chest-Left Ankle, Right Ankle-Left Ankle). The features include the mean value and standard deviation for each reciprocal RSS reading from worn WSN sensors. For each activity 15 temporal sequences of input RSS data are present. The dataset contains 480 sequences, for a total number of 42240 instances.
How to start
To start the application, you have to start the a webserver. We created the application with Brackets.
It is important to have an internet connection, because the libraries are downloaded via cdn-servers.
Downloads

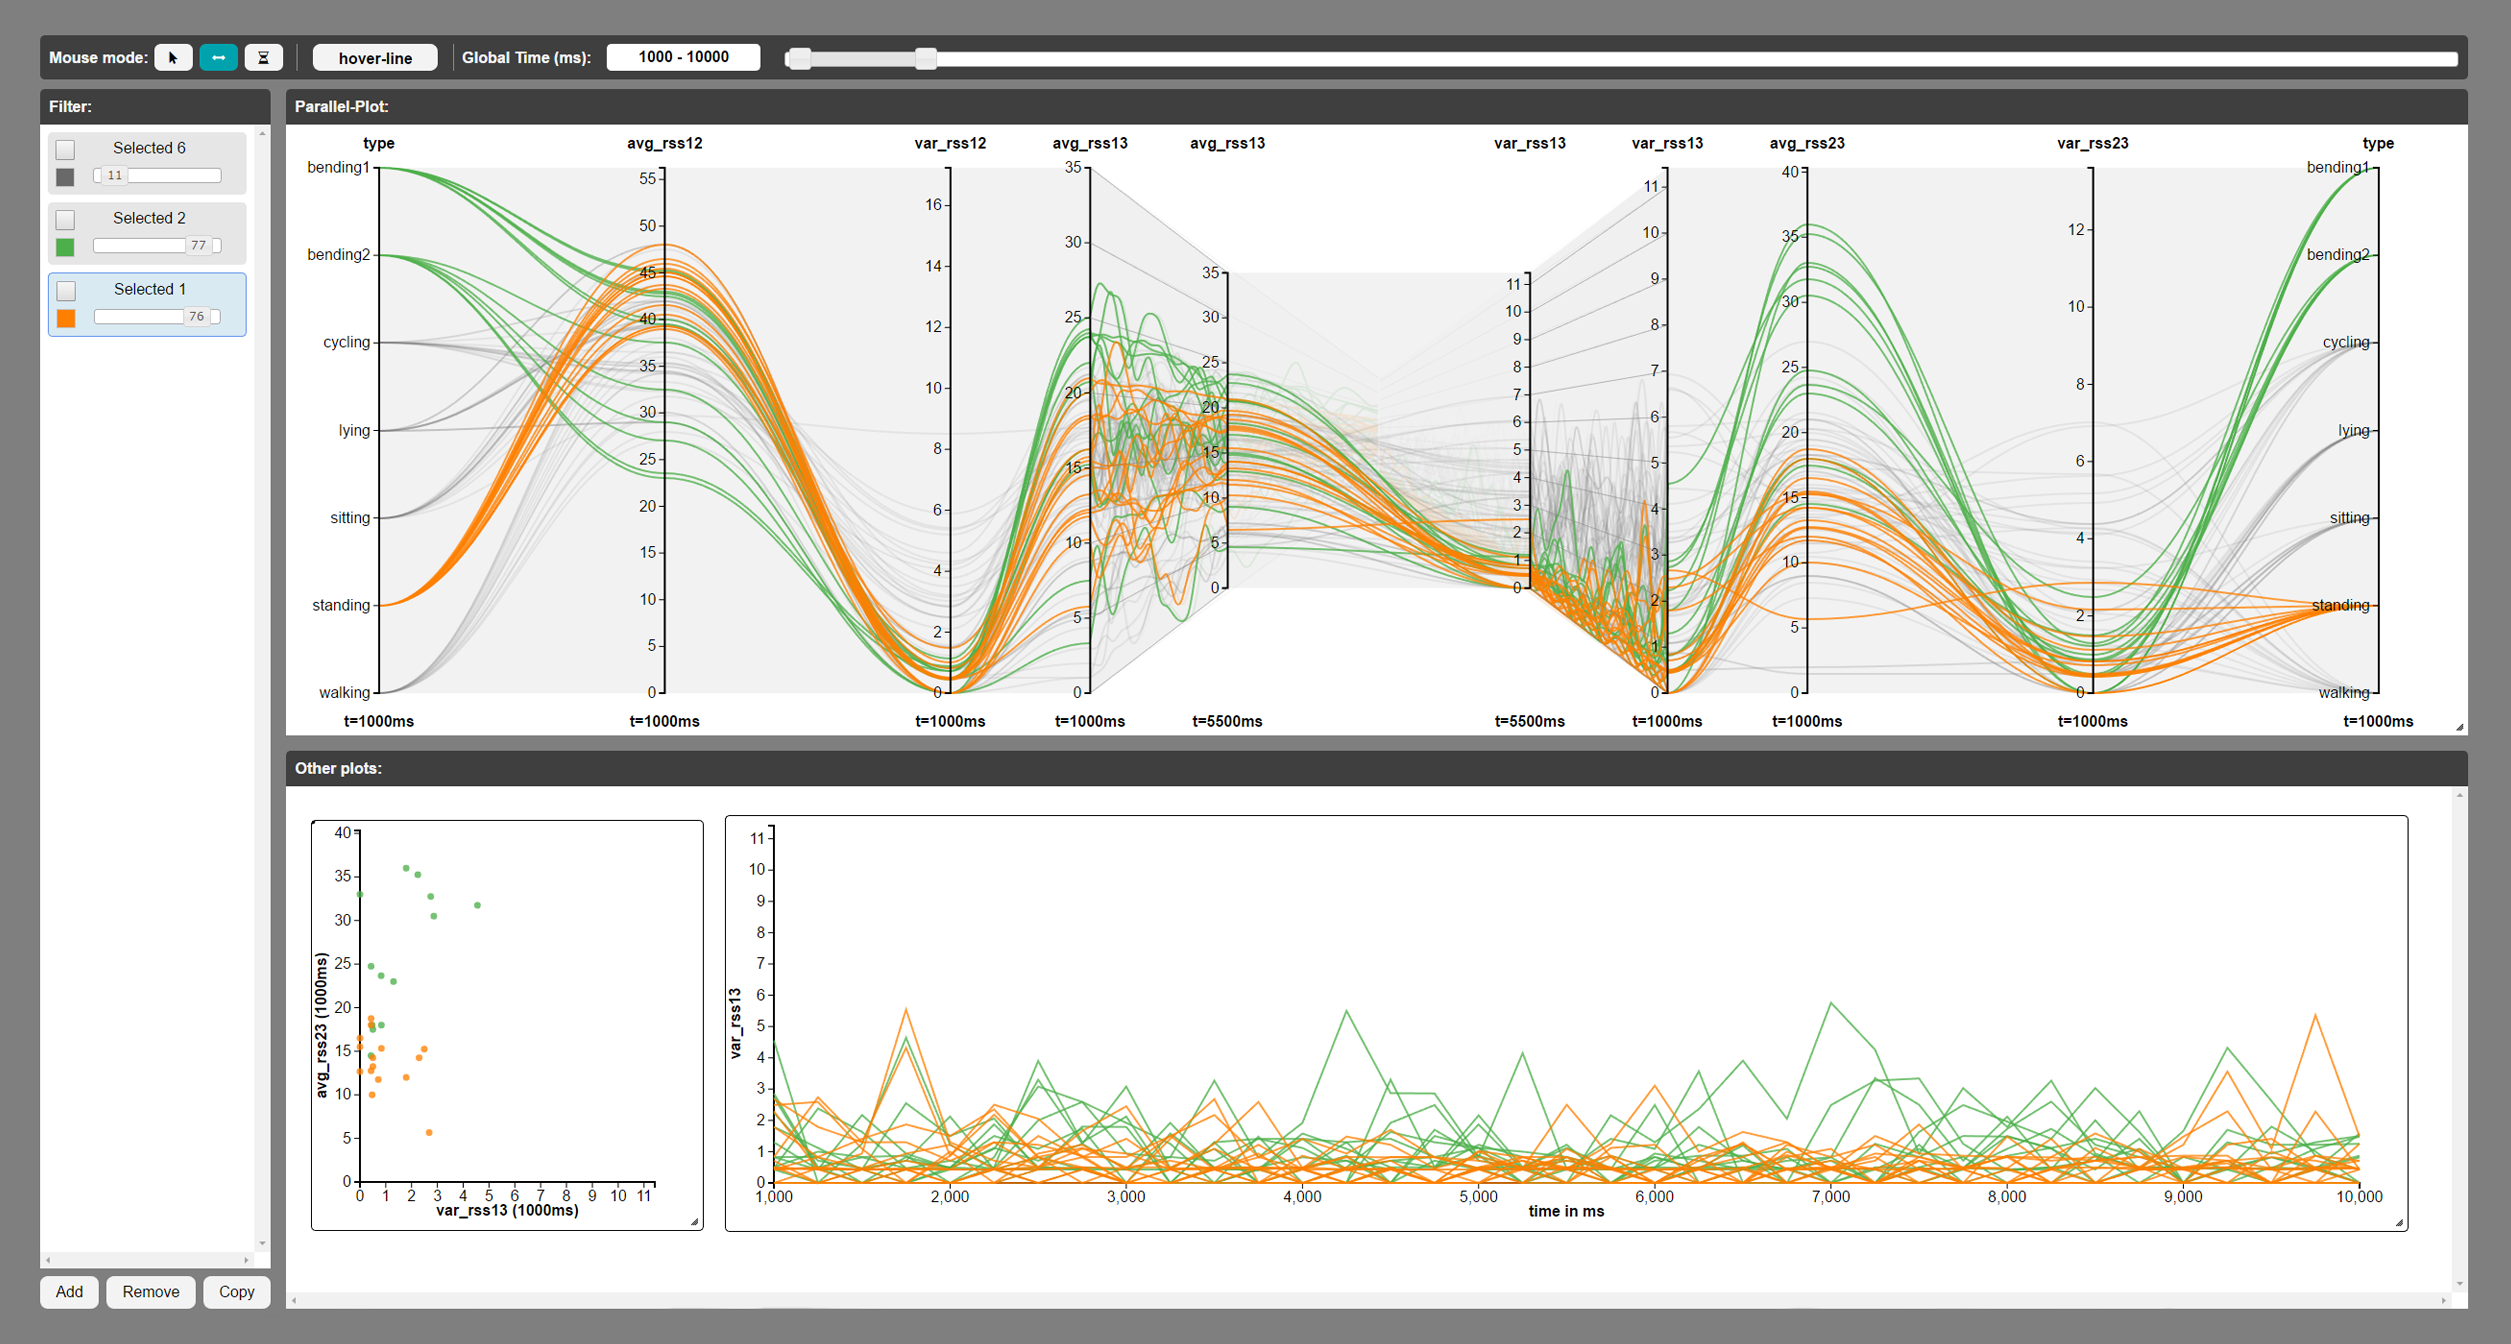
Screenshot
Implementation details
Used libraries:


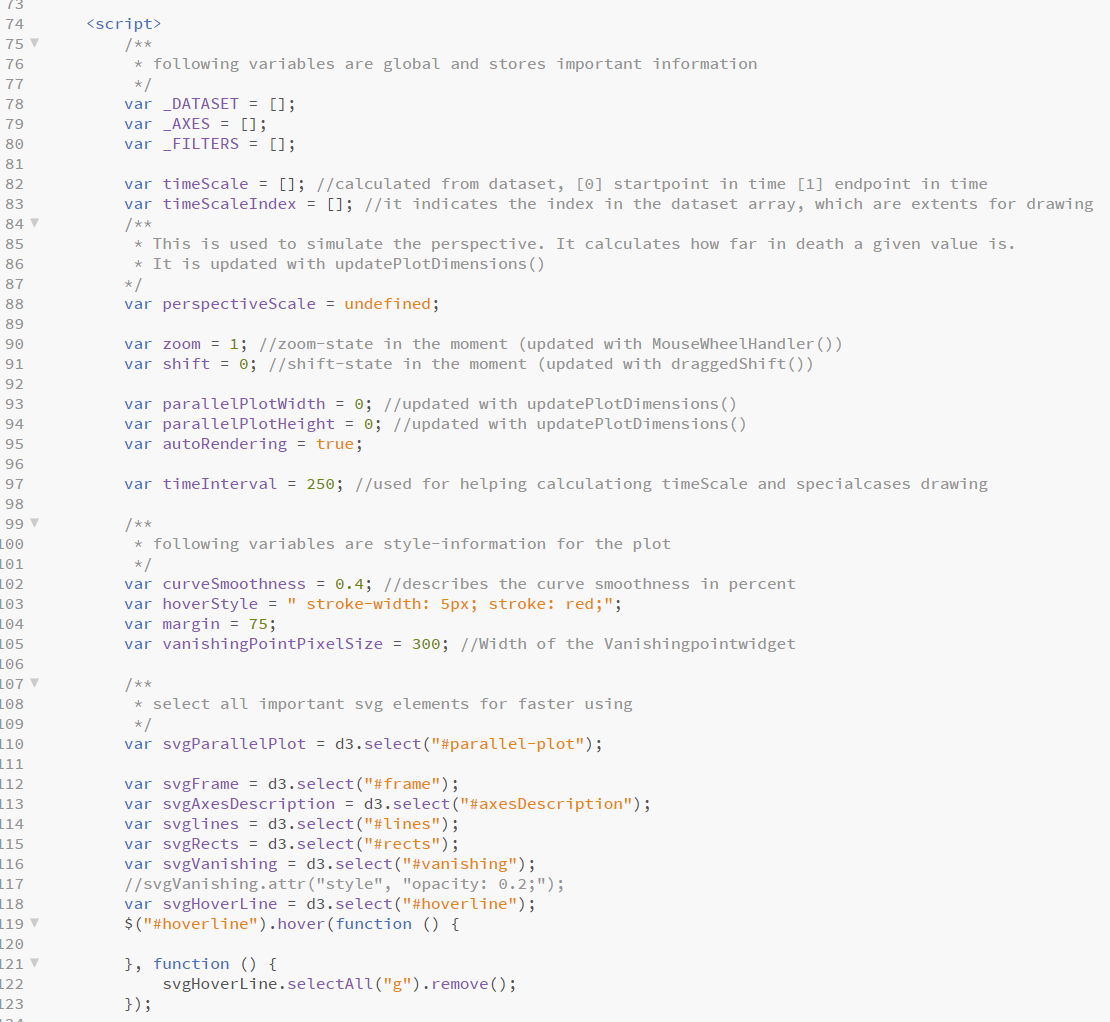
Code-Documentation:
Interactions

Interaction with the plot:
If you click between two axes, you can create a vanishing point or a new axis between the axes. In addition, a scatterplot can also be created by the two attributes of the adjacent axes. If you click on the axis you can also remove it or create a time series from the axis (not possible in mouse mode)
Mouse-Mode:
In mouse mode you can brush the axes. At the same time, the selection is also linked in other axes. It will be possible to draw up an area on the axes which filters the data values or changes them to a specific color.
Move-Mode:
In move mode you can move individual axes as well as the whole diagram at once. In addition, it is possible to change the zoom with the mouse wheel.
Time-Mode:
In time mode it is possible to change axes in time. If this option is activated, the axis is changed in time when the axis is moved up and down. So you can look at an attribute at different times. To change the entire graph in time, you havt to use the mouse wheel. It is also possible to change two adjacent axes together in time by clicking and dragging on the area between the two axes.