We have implemented a flow visualization tool after "Streamline Variability Plots
for Characterizing the Uncertainty in Vector Field Ensembles" by Ferstl et al. 2016 [1] allowing stream- and pathlines to be clustered into different trends emphazising
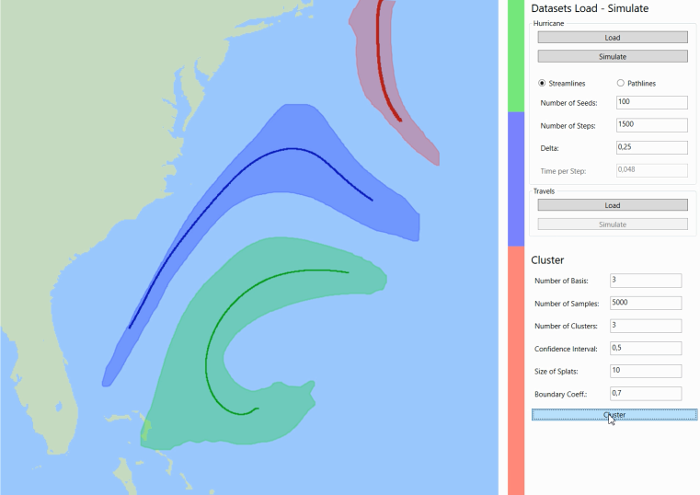
a streamline median (middle line of a cluster), the convidence lobes around the median and the number of streamlines in a specific cluster by a coloured barplot.
The streamlines are firstly generated, pca is transforming the data allowing clustering.
In each cluster a streamline median is determined and streamlines are sampled back and plotted in 2D using splatting and surrounded by a boundary. These Streamline
Variability Plots show trends and statistical parameters (like the confidence interval) in the same domain the data resides.
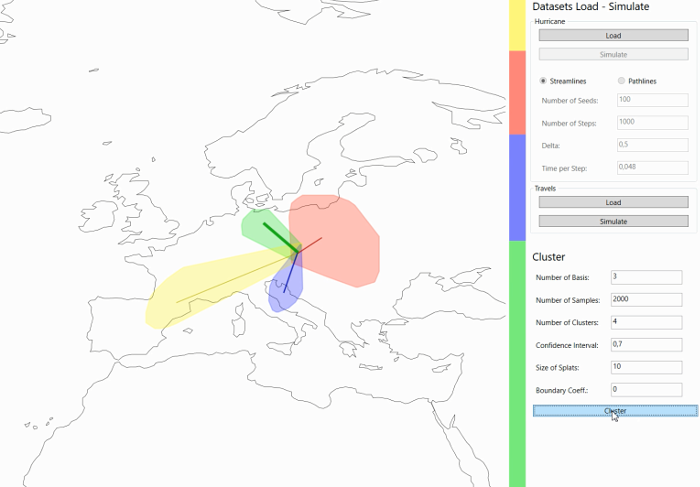
Furthermore, we applied this technique to a new kind of data: Travel Data, to create an informative visualization showing major tourism trends.
Configuration
Matlab needs to be registered as a COM Server,
use following command in Matlab with administrator privelege
!matlab -regserver
The following Matlab command needs to be executed and the output saved in the system variable PATH under Systemumgebungsvariablen bearbeiten/Umgebungsvariablen
res = fullfile(matlabroot,'bin',computer('arch'))
The config file SVP.config needs to contain the relative paths from the exe file to the folder containing the Malab scripts and the u and v.csv files
The first line contains the relative path to the Matlab files
The second line contains the relative path to the csv files
How to use
The typical workflow of the program consists of 3 steps, Load, Simulate and Cluster, by clicking
on the respective buttons on the right panel.
Load
Hurricane: Button for the Hurricane Dataset
Travel: Button for the Travels Dataset
Simulate
Hurricane: Either Stream- or Pathlines sumulation over Runge Kutta integration.
Parameters like the
Number of streamlines,
Number of steps (number of integration steps),
Delta (step length),
Seed Origin Rectangle specified by two mouse clicks on the map,
and Time per step for pathlines
are changable.
Travel: No specific parameters
Cluster
Parameters like the
Number of basis (used for the representation of the streamlines in the pca space),
Number of samples (used for each cluster for confidence lobes),
Number of clusters (between 1 and 5),
Confidence interval (between 0 and 1, determines the width of each lobe),
Size of Splats,
and Boundary coefficient (between 0 and 1, 0 for a convex boundary and up to 1 for a concave boundary)
[1] Ferstl, Florian, Kai Bürger, and Rüdiger Westermann. "Streamline variability plots for characterizing the uncertainty in vector field ensembles." IEEE Transactions on Visualization and Computer Graphics 22.1 (2016): 767-776.