Phrase Nets
TU Wien - Visualization 2 - Lukas Prost 1225511
This work is based on "Mapping Text with Phrase Nets" by Ham, Wattenberg and Viegas in IEEE Transactions on Visualization and Computer Graphics, vol. 15, no. 6, pp. 1169-1176, Nov.-Dec. 2009.
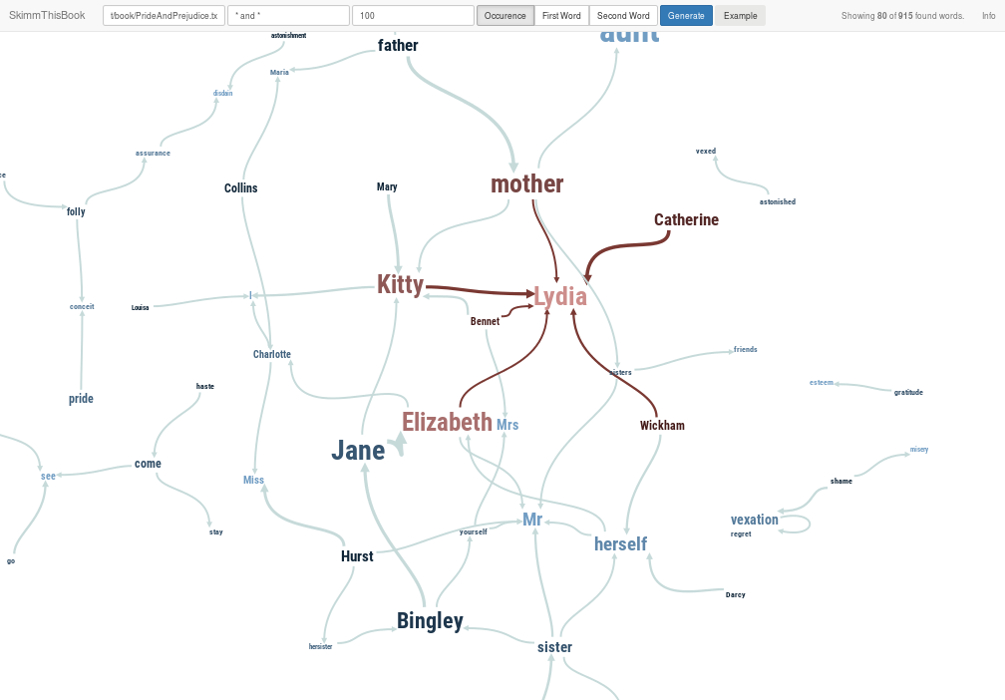
The implemented application allows to render phrase nets of books. A phrase net is a graph where words are nodes which are connected by phrases encoded in links. E.g. if book contains the sentence "I ate an apple and an orange." and user searches for the phrase * and an * (two words connected by "and an"), the resulting graph will show an apple node with a link to an orange node. Such phrases can be used to explore complex relations inside books between locations or between characters.
The size of a word shows how often it was found compared to other words. The darker a word is, the more often it was at the beginning of a phrase. The brighter it is, the more it was at the end of a phrase. For the links: the thickness encodes how often the relation between the words occurs.
Installation
To run the app unzip the application zip file (download here) and change the directory to
skimmthisbook-1.0-SNAPSHOT/binlocalhost:9000Instead of running the application on your local machine, you can also visit this site where you can use the application online.
Implementation
The application was implemented using the Play Framework in combination with a website that uses D3-Javascript. The website is the frontend that takes the user request and sends it to the backend that is given as a REST API implemented using said Play Framework. On the backend, the user data is processed and the phrase net is generated. After it is finished, it sends the final net as a JSON file back to the frontend where D3 renders it as a graph. For the graph rendering cola.js was used. It is an extension for D3.
The full source code can be found here. The code specifically for the backend can be directly accessed here. The JavaDocs can be found here. Frontend source code can be directly accessed here.
How to use it
You provide a book, a phrase and a maximal number of words you want to see. The application then searches through the book based on the input.
An example would be
Book: http://www.gutenberg.org/files/2600/2600-0.txt (War and Peace)
Phrase: * and *
Max number of words: 100
Book has to be an URL. You can link it to any page, but you get the best results if you use plain text books.
Phrase uses the * symbol as a symbol for any possible word. Your phrase should start and end with a *. Inbetween you can write what you want. The application takes this phrase and searches it in the book. The start and end star become the words you can see in the graph. The text inbetween becomes the line between two words.
With the maximal number of words you can define how many words you want to see at most in your phrase net. Sometimes you see less words, basically because there where no links between the top most words. Which words are shown depends on your filtering selection. You can select those words that occur most often, those who were most often the first word or those who were most often the last word of a phrase.
The final graph can be dragged and zoomed. Nodes can also be dragged. By doing so, the graph can be relayouted for better reading if the computed layout is not sufficient. If a phrase net is too overloaded and you have a hard time finding relations, you could either show less words or you can click on words that you are interested in. If you click on a word, it gets highlighted. So do all other words that are connected to the word and the links inbetween.