
About
This page provides a practical reproduction of the paper: Visual Clustering in Parallel Coordinates by H.Zhou et.al.
The implementation is done in Matlab by Michael Mazurek and Matej Bartalsky.
Parallel Coordinates have the disadvantage that with increasing number of data between two coordinates, the diagram becomes unclear, so it is hard to distinguish and to compare the data edges.
The main idea of the provided paper is to allow bending of edges to form cluster. For further information, please visit the sections below.
Theory
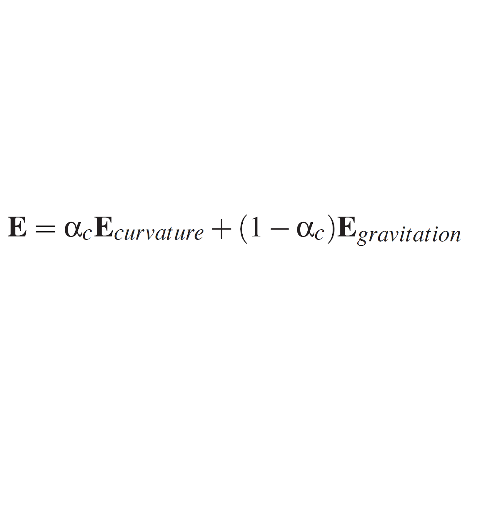
To cluster parallel coordinates, we can try to bend the edges to each other, so that bunches of edges can be created. The bending of each curve can be described as an energy term, which means that the higher the bending of the curve the higher the energy consumption of the graph. The energy term consists of the curvature and the gravitation term. The gravitation term is responsible for moving the edges towards other edges and the curvature term takes care, that the curves don't bend too much. Our aim is to find a solution with minimum energy consumption, this can be done by solving a system of linear equations.
For each edge we can compute a force(which is F_ij in the figures.) out of the neighbouring edges. The force can be determined with the distance and the angle between edges. The angle factor means that the higher the angle between some neighbouring edges, the less the force for the concrete edge.
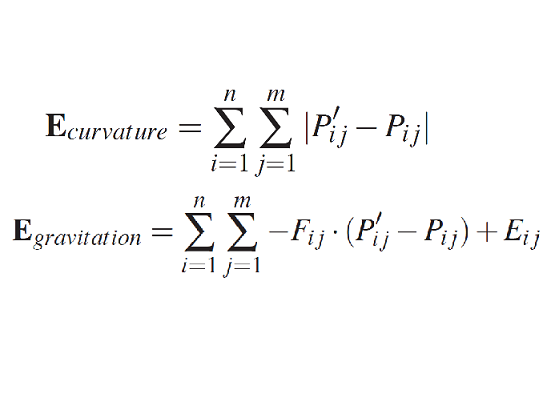
Solving the system of linear equations can take a lot of computing time, which makes interaction not possible in real-time, but nevertheless it's a better approach than trying to approximate the curves. P_ij are the old sub coordinates and P'_ij are the new positions. Additionally, m are number of sub coordinates and n the number of edges, which means that a point ij is a sample point.
After solving the system, we will get the new positions of the edges. These new coordinates are used as control points for drawing curves (e.g. Bézier curves).
Furthermore, the already clustered data edges can be visually improved by applying color and density functions to show the acquired characteristics of the data.
Implementation
Technologies
We decided to implement the project in Matlab and for solving linear equations we use the software lp_solve 5.5. There is also an official Matlab lp_solve API.
The Application
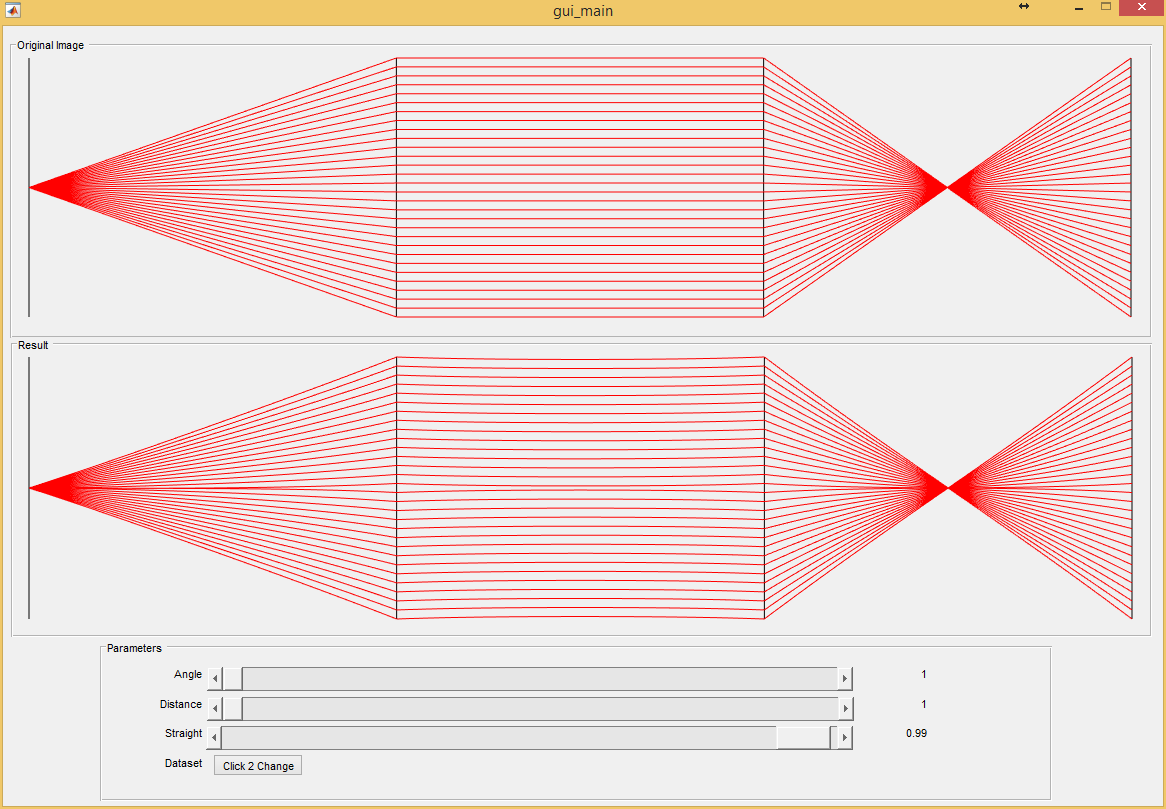
We created a simple Matlab GUI, where we can choose the input data and also try to change some coefficients, which are then applied on the dataset. The computation takes a few seconds, but it was only tested for small datasets, e.g the well-known iris set. Bigger datasets can take even longer (also mentioned in the paper). The coefficients angle and distances influence the level of clustering and straight controls the contribution of the energy terms curvature and gravitation.
The application process: We choose a multivariate data set, which we want to cluster. First of all, the application creates 3 sub coordinates between each two columns of the outgoing data. The number of sub coordinates is fixed, because a higher number of coordinates just tends to create a zig-zag pattern and it also increases computing time. Then, the force is being computed based on the neighbouring edges of each edge. It takes the distance and the angle between the edges. With the force coefficient, we can now set up the optimization problem, which is the energy equation of the curvature and gravitation term. After the minimization problem is solved, we get the new positions of the sub coordinates, which are finally used as control points for drawing curves. For detailed information, please have a look at the source code documentation.
Source Code
The source code can be downloaded here: download. Please, don't forget to read the README datafile to successfully start the application. A screenshot (full size) can be found here: screenshot
Code Documentation
The code documentation was generated by m2html and can be found here: documentation