Tofi TimeNets documentation
Paper: http://vis.stanford.edu/papers/timenets
Introduction
TimeNets are an improved concept to visualize genealogical data.
They combine hierarchical visualizations of conjugal and consanguine relationships with timelines.
In this way more information can be grasped from the visualization than in classical family trees. Nature and length of relationships, life spans, contemporaries, and interesting life events are a few concepts that can be easily displayed in TimeNets, but not in family trees.
To stay on top of this density of information a Degree Of Interest technique is introduced to visually filter the data.
For the course we implemented the introduced TimeNets, based on their proposed layout algorithm.
A SQLite database provides our genealogical data. The database is connected to a Node.js (JavaScript) server, which sends the data to a client for visualization.
Installation
First, install Node.js with npm (node package manager). Use npm to install socket.io and sqlite3:
> npm install sqlite3
> npm install socket.io
After that, change to the project directory and start the server with:
> node server.js
Depending on your environment, you may need to type nodejs instead of node.
Open up a browser and go to http://localhost:8080/.
How to use
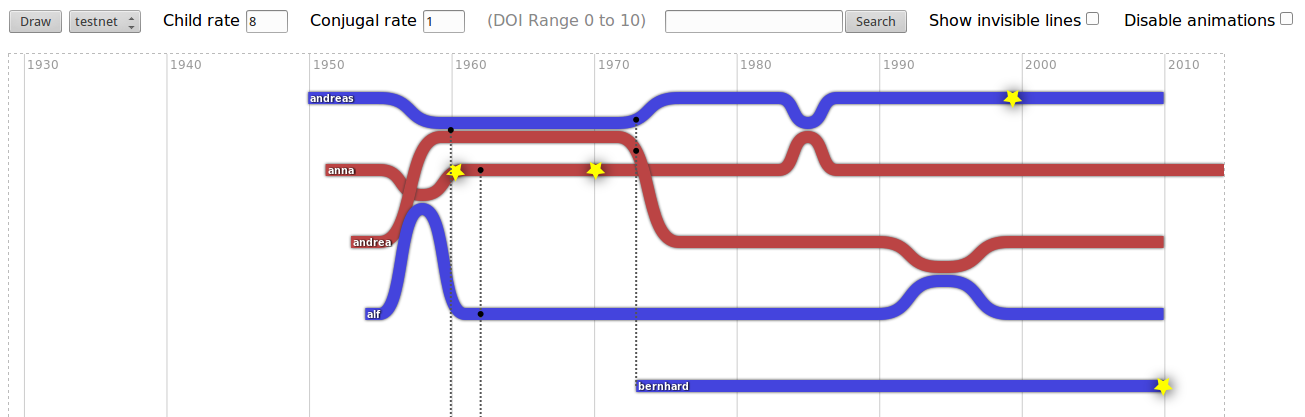
We designed the user interface to be self-explanatory and almost all control elements have tooltips. There are several GUI items in a row. From left to right:
- By pressing the "Draw" button, the selected TimeNet is retrieved from the server and displayed
- The dropdown box shows the available TimeNets in the database on the server
- The child rate is the rate at which the DOI (degree of interest) value drops over a child relationship
- The conjugal rate is the rate at which the DOI value drops over a conjugal relationship (meaning inside a block)
- After the child and conjugal rates, the minimum and maximum DOI values are displayed
- The search box can be used to select a focus line
- When "show invisible lines" is checked, lines that would otherwise be invisible, are drawn with lower opacity. Also, the DOI values are shown at the end of the life lines.
- You can also disable the animations
For most settings, the "Draw" button has to be pressed again afterwards to refresh the canvas. Click on lifelines to make them the focus lines (maximum degree of interest).
Code Documentation
The code documentation shows all the important sections in our code. Since javascript has no real classes and is dynamically typed, objects and functions are mixed in our code and are sometimes extended after they have been created. We decided to have one file each for the server (server.js) and the client (client.js) and documented the code using YUIDoc. It is designed for strictly object-oriented code, so we just labeled the two files as classes and modules (Client, Server). Functions are listed as methods and functions that begin with a "*" are just sections that we thought should be commented and named.
Implementation
Since we only need 2D vector graphics, JavaScript in combination with HTML5 provides a suitable environment for implementing TimeNets. It runs in every modern desktop browser and does not require compilation. HTML is great for building user interfaces and eliminates the need for GUI toolkits. Since we needed access to a database, we had to use a Client-Server architecture, because client-side JavaScript alone can not access files.
We did the drawing with a JavaSript vector graphics library called Paper.js. It made the drawing itself easier, so we could focus on the important points of the paper: layout, degree of interest, etc.
Datenmodel and Data estimation
We took the base datamodel of TimeNets with some additional data, and mapped it to our database. The database is designed scaleable for more than one TimeNe.t
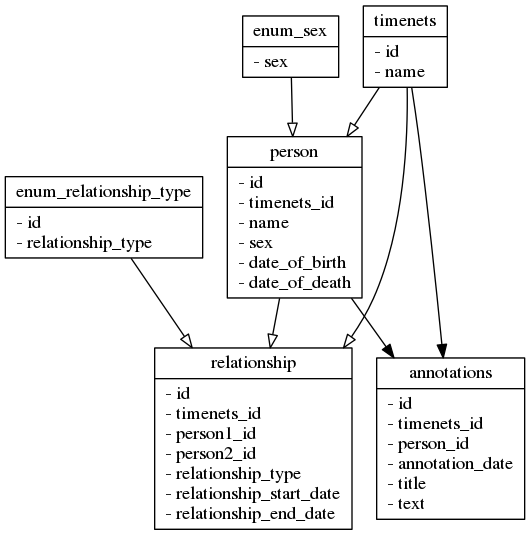
Since our datamodel is very restrictive, missing data has to be completed at submission. We still have to check for consistency, for example a child has to be born on the exact same date as the child-parent relationship begins.
Layout
The layout algorithm has two steps. First all persons in conjugal relationships are segmented into local Blocks.
 All local Blocks are aware of all its people's children. These local blocks are ordered vertically according to following rules:
- The blocks are orderd increasingly according to the earliest childbirth of the blocks.
- After each block, we insert all blocks which include the block's children, beginning with the youngest child.
- At last we draw all Blocks without children from first born to last born.
Degree of Interest techniques
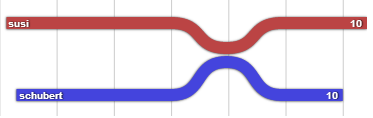
When nothing is selected, every lifeline has the same DOI value and is displayed the same. When something is selected by mouse click or search, it gets the maximum DOI value. Like in the paper, there are two rates at which the degree of interest decreases over relationships to other people. The default setting is a faster DOI decrease over child relationships than over conjugal ones.
When a person with a DOI value over the visibility threshold (=0) is in a relationship with someone below the threshold, the second lifeline will only be visible where it is relevant for the visible lifeline. The same goes for drop lines (child births).