In this documentation, we will describe the functionality of our developed application for the exercise part of the lecture "Visualization 2". The aim of this application will be described in Section 1. Section 2 will be split up into three parts, where each of the views that are provided by our application will be described. The statistical analysis system behind our visualization tool will be explained in Section 3, and Section 4 contains a description of the used technology.
Our application is an almost complete 1:1 implementation of the application described in the paper published by Oelke et al. [1]. The purpose of
this tool is to provide a writer a possibility to revise his writing from a statistical and structural viewpoint. This includes aspects like
contextual coherency, avoiding unknown vobabulary or difficult grammatical structures, and misspellings. After the writing has been revised, the
applied tool provides a detailed feedback about passages and sentences.
As the authors mention in their paper, the statistical properties of a text that are measured include word length, number of words in a sentence
/ paragraph, use of easy or hard words, or number of stop words. Stop words are in this context words, that carry no information whatsoever.
Concrete examples are "and", "to", "then" and many others. These stop words are also very often filtered out by search engines such as Google,
but also in textual searches in a database. The second type of properties that can be measured in a text are the structural properties. These
include for example the depth of the parse three of a sentence, number of sentences in passice voice, and others. Due to the fact, that the
structural properties include an extensive analysis of the sentences and are therefore out of the scope of this exercise (the main purpose
is the visualization aspect), we only implemented the statistical properties. After an evaluation of the different available
statistical and structual properties, the authors decided to use 5 of these properties in their application. The used properties are:
As can be seen, only the first two properties are actually statistical properties. Prior to implementing our analysis module, we prepared the UI
for the implementation of all the named five properties, however later we realized, that only two of these can be effectively implemented in
the available time. Therefore we decided to implement a third analysis property, that is based on a vocabulary and leave the remaining two properties as
stubs. The third implemented statistic is the number of stop words, and the remaining two properties include purely randomized values.
To be able to implement the proposed application in an effective way, we needed to represent the text in a hierarchical structure, namely a tree.
The whole text is first divided into paragraphs, these are further divided into sentences, and these are in turn divided into words and stored in
a list. The sentences and paragraphs are modelled as individual classes (entities) and store the computed analytical properties. After an analysis
has been performed, the computed properties are visualized in three different views, that are described in detail in Section 2.
Our rating scheme uses a normalized scale in the interval [0 1]. Here, 0.5 means that a measured property is average, 0.0 means it is the best achievable
measure, and 1.0 means analogously the worst possible measure. To give an example, when looking at the word length in a paragraph, the rating scheme is
normalized between the mean word length minus three times the standard deviation (0.0) and the mean word length plus three times the standard deviation (1.0) in the corresponding paragraph. The sentence
length is measured in an analogous way to the word length. The third measure, namely the number of stop words, should define the information content of
a sentence or a paragraph. Herefore we divide the number of non-stop words in a sentence / paragraph by the total number of words in a sentence / paragraph.
The stop words are included in a dictionary, that is defined by the class StopWordDictionary. This class contains a HashSet of these words and
checks during the analysis process wether each word of the sentence is included in the HashSet. We specifically chose a the HashSet as the datastructure
that stores the stop words, because the complexity of the "contains()" function is equal to O(1).
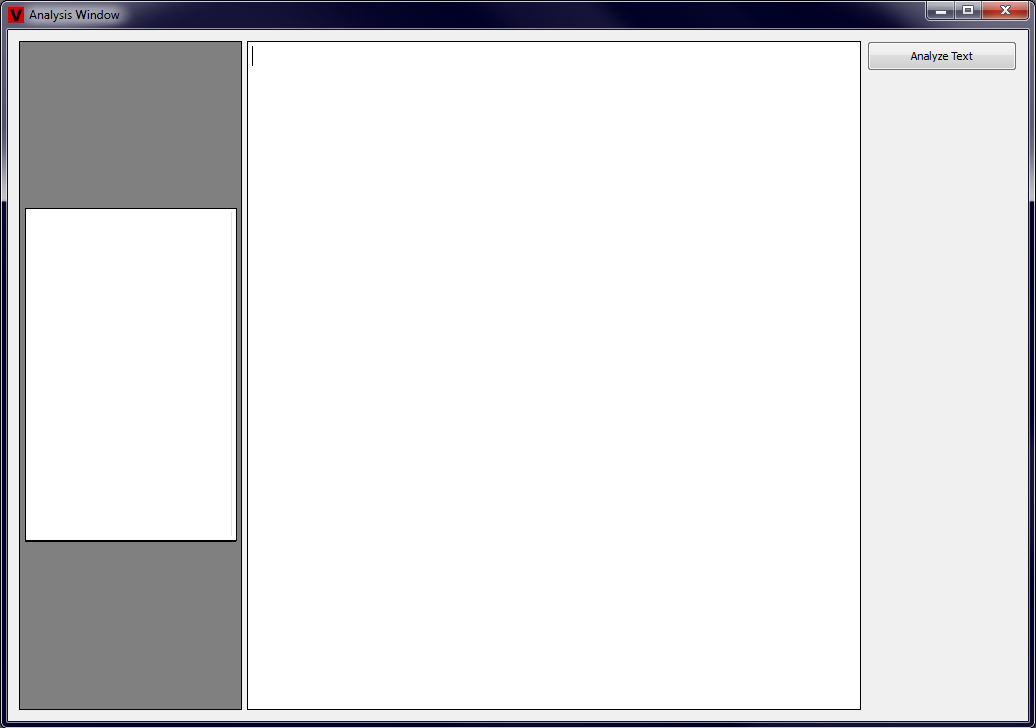
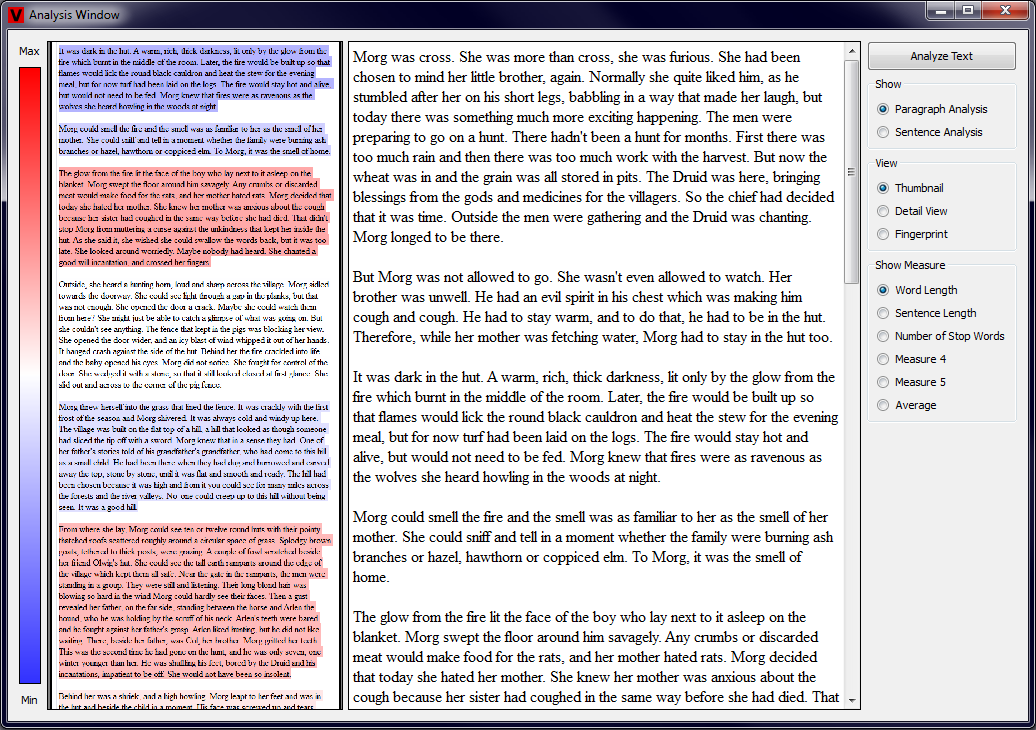
The main window has a very simple UI. On the left side can be seen the Analysis View, which serves the purpose of visualizing the results of the
analysis. Further in the middle of the main window, there is the Text View that contains the main text to be analyzed. We used only a very simple
algorithm that separates the individual sentences and paragraphs of the text, therefore a warning text appears in the Text View, if a syntactically wrong
sentence is attempted to be analyzed. Further, on the right side can be seen the Analysis Button, which starts the analysis after a text has been
written or pasted into the Text View. The UI of the main window can be seen in the picture below (click to enlarge).
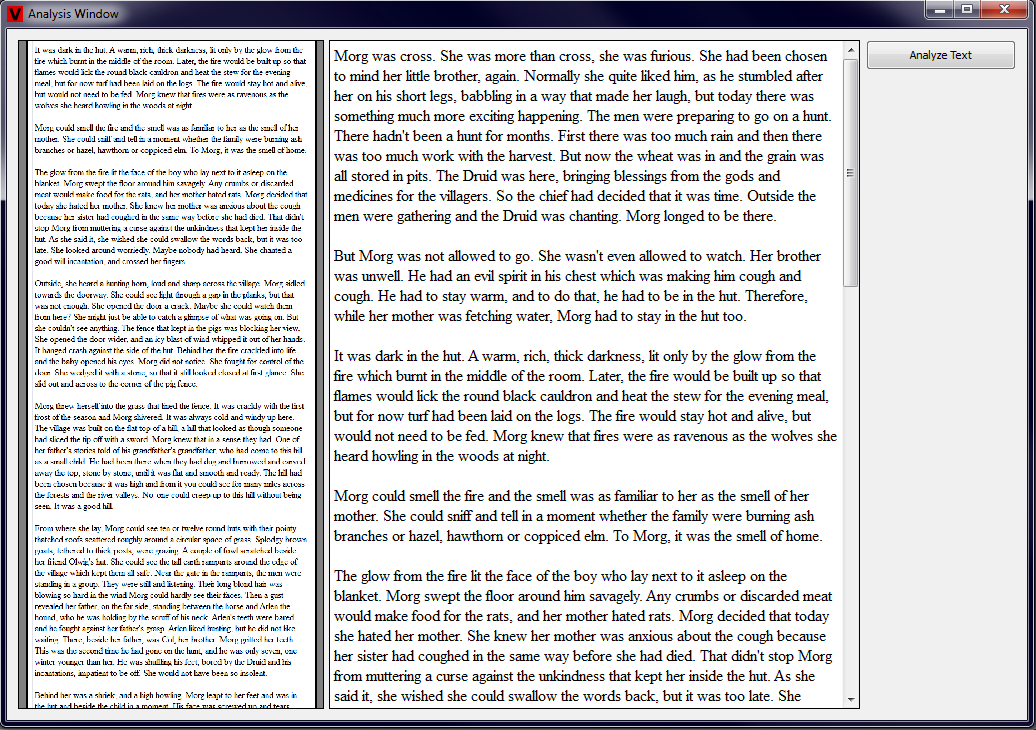
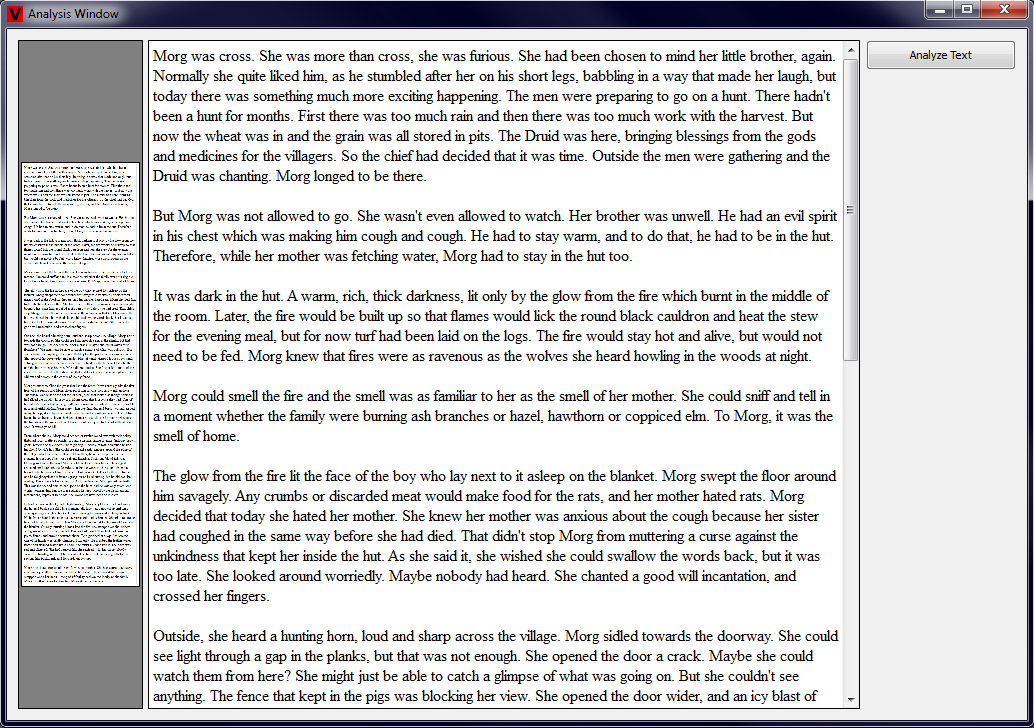
After a text has been written in the Text View, the Analysis View is updated by default and it shows a miniature version of the Text View to provide the
user a better idea of the structure of the text. By dragging the separating pane between the Analysis View and the Text View, the miniature is being
magnified or demagnified. Examples of this process can be seen in the two pictures below (click to enlarge).
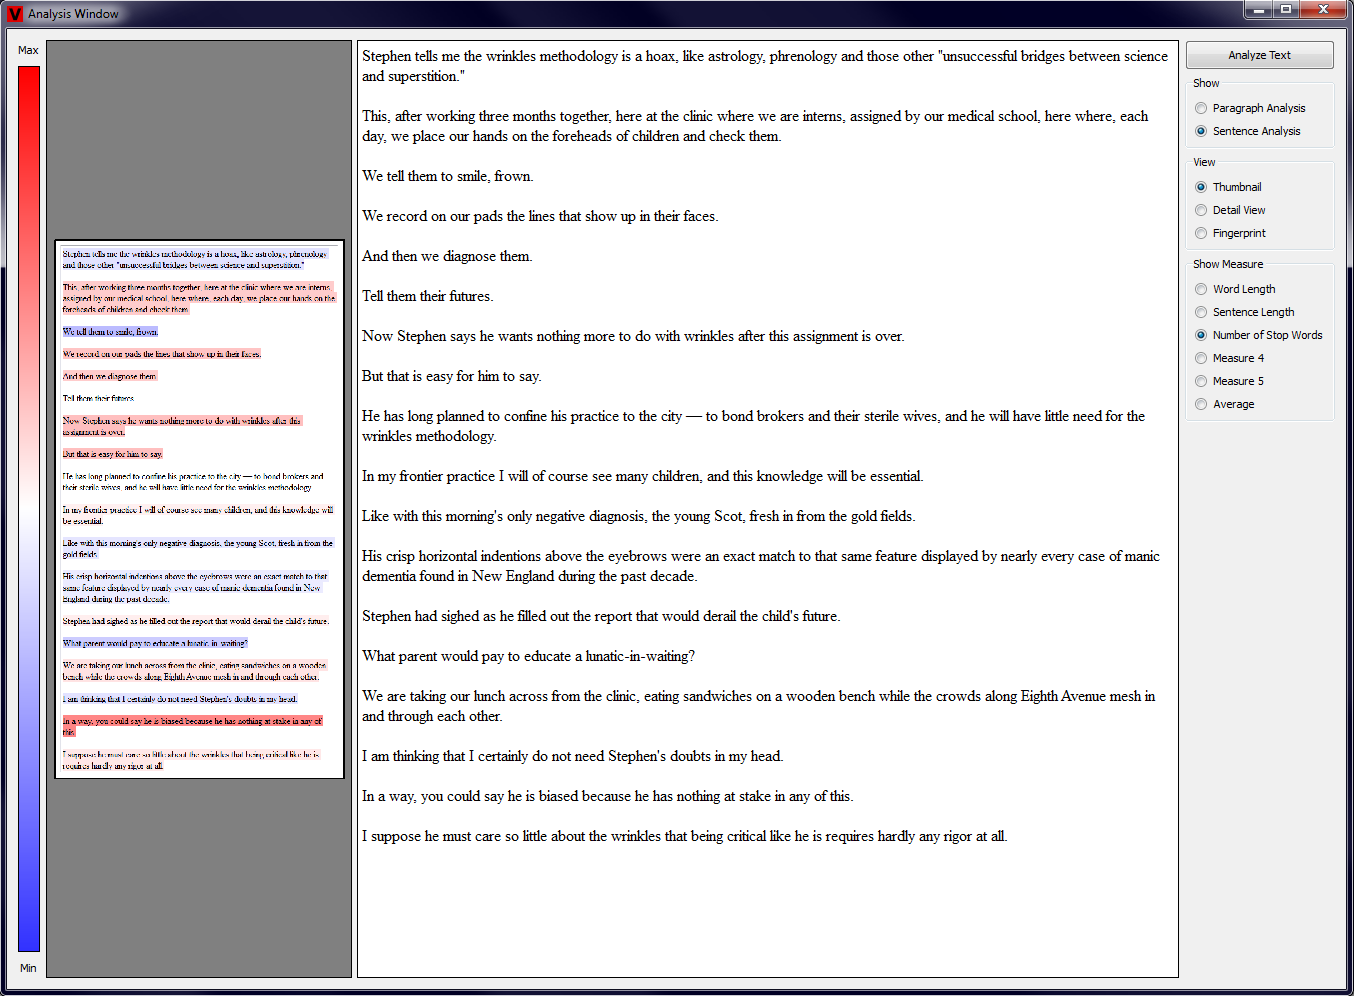
When the user selects the Thumbnail View in the radiogroup, that appears on the right side of the main window after the Analysis Button has been
pressed, a smaller version of the Text View is shown. In this smaller version the text is highlighted in the color, that corresponds to the computed
text properties - red being 1.0 and blue 0.0. An additional image of this rating scheme is shown left to the Analysis View for better user feedback. The
user has additionally the possibility to choose wether the paragraphs or sentences should be analyzed by clicking on the appropriate radio button on the
right side of the main window. Examples of this Thumbnail View are given in the two pictures below, the first showing a paragraph view and the second a
sentence view (click to enlarge).

The user further has the possibility to resize the Thumbnail View by dragging the pane between the Analysis View and the Text View to the right or left.
This functionality remains always enabled for each of the possible analysis views. Additionally, the user has the possibility to choose which analyzed
property should be shown in the Thumbnail View by clicking on the corresponding radio button on the right side of the main window.
The Thumbnail View has been implemented by using a trick in the used UI library (QT Jambi). Our application implements two different text edit fields -
one visible in the middle of the screen (Text View) and one invisible, that serves as something like a back buffer. When the user is viewing the Thumbnail
View, the contents of the Text View are copied to the invisible text edit field, the text is highlighted and a screenshot of this text edit field is taken.
Afterwards, this screenshot is simply shown in the Analysis View.
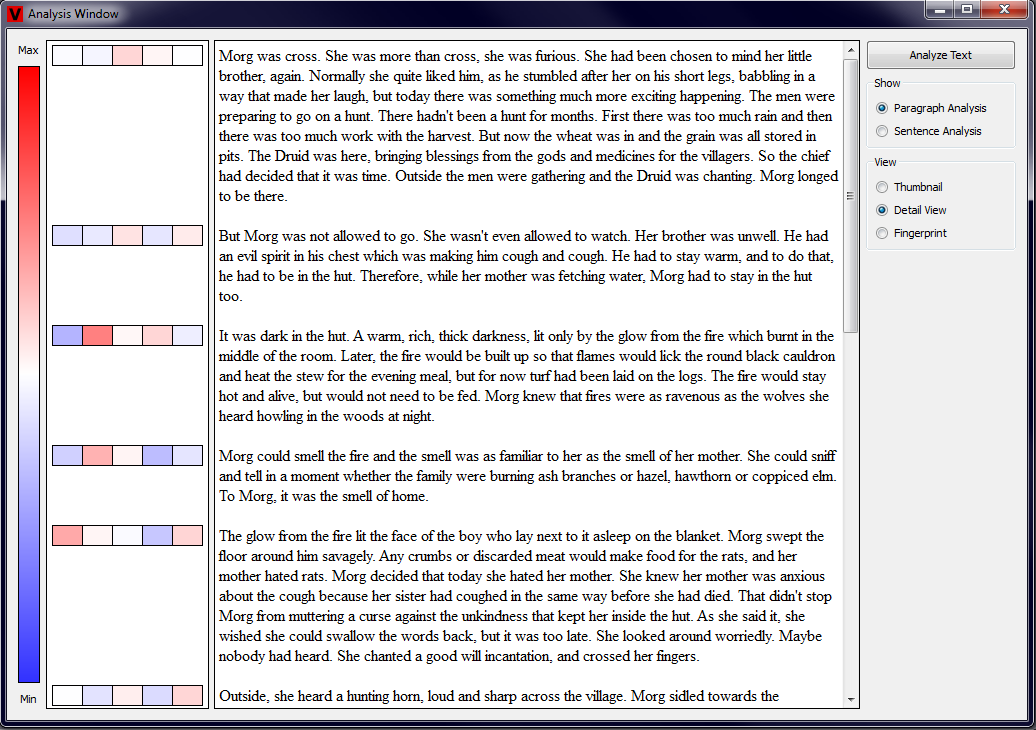
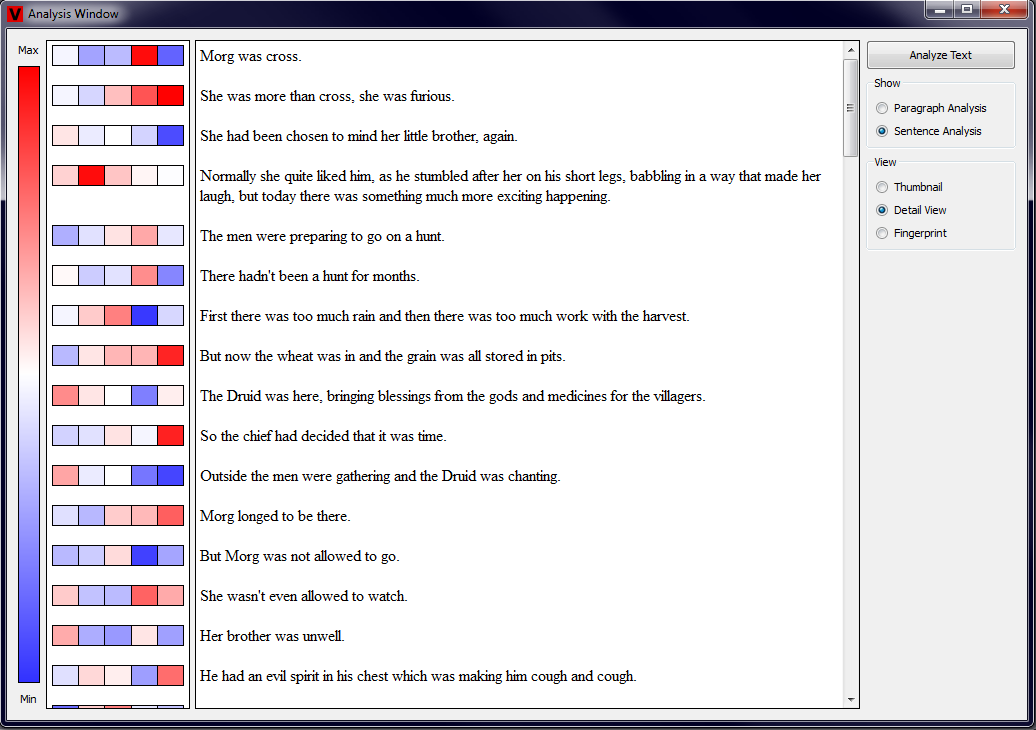
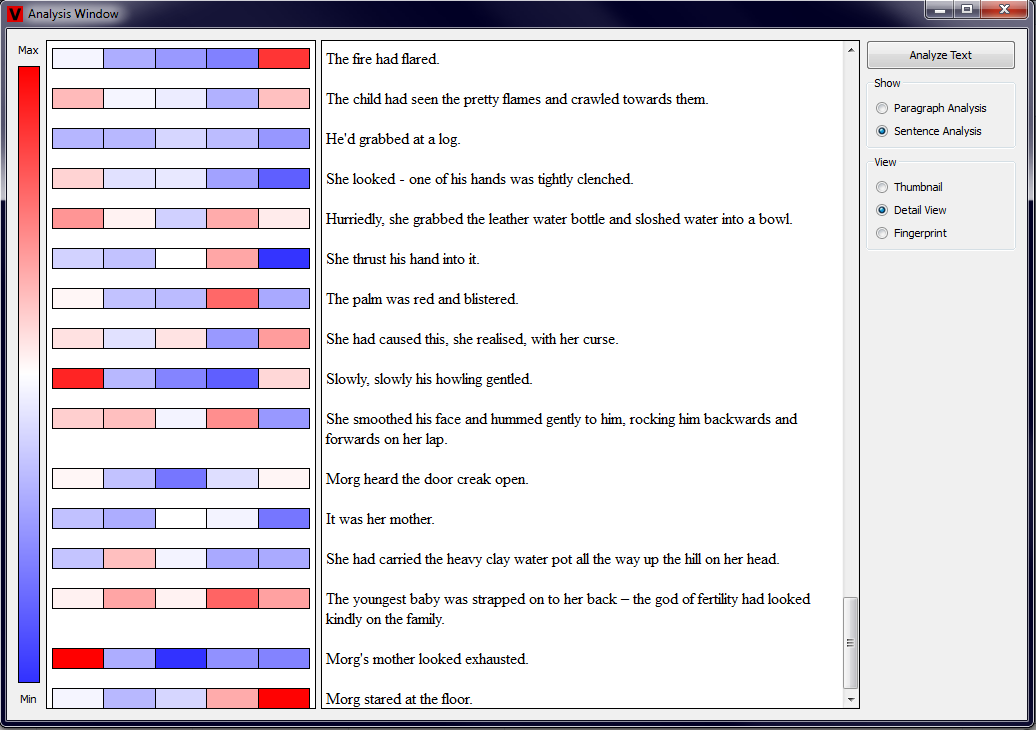
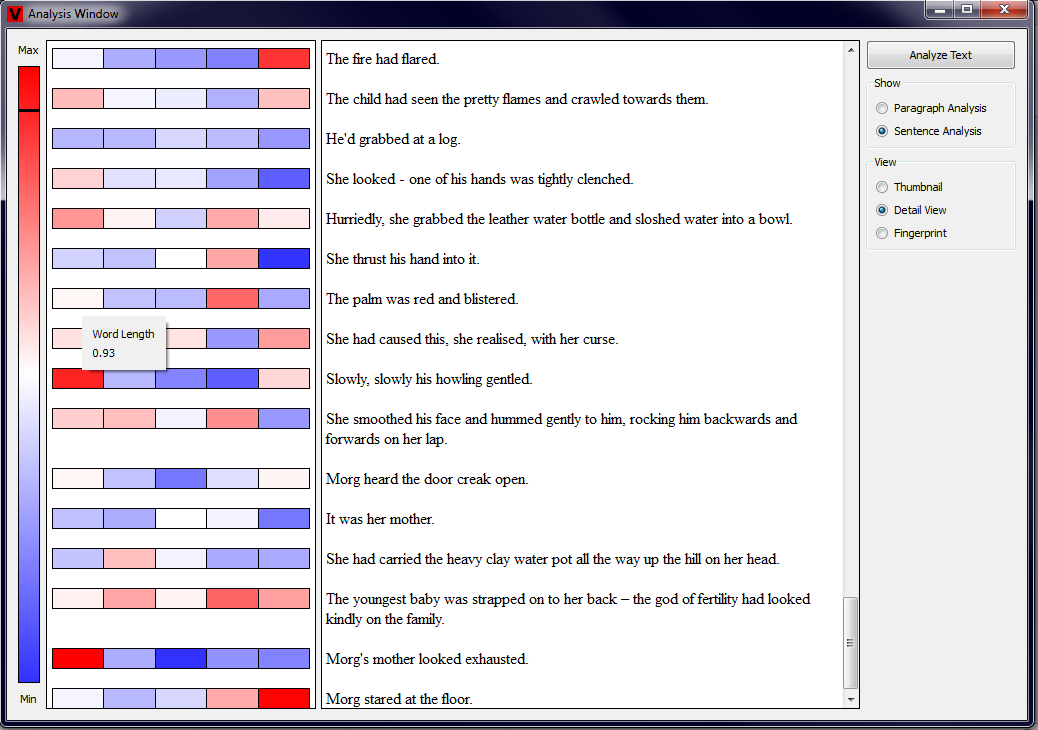
The Detail View is a more concise visualization of the analyzed properties than the Thumbnail View. Here, next to the beginning of each paragraph or
sentence, a large rectangle that is divided into five equal parts corresponding to each of the properties is shown. Each of the subrectangles is colored based
on the values of the measured properties. The user again has the possibility to enlarge or reduce the size of the Analysis View and thus also change the size
of the rectangle showing the results. Examples showing the Detail View in action for a paragraph and sentence view are shown in the two pictures below (click
to enlarge).
We also implemented a little window that is being shown after the user clicks on one of the subrectangles. This window contains the description of which
measured property corresponds to this rectangle and the value of the measurement. Additionally, also a black line is drawn on top of the rating scheme image
to give the user an idea where the measured value is in the interval of possible values. Examples showing this functionality are depicted in the two pictures
below (click to enlarge).
The implementation of this type of view is pretty straightforward. We determine the width of the Analysis window and compute the resulting width of the
rectangles in the Detail View. Afterwards, we split up this rectangle into five parts and draw five colored rectangles inside with help of the provided
functionality of the GUI library. When the Analysis View is resized, the size of the rectangles are recomputed and redrawn.
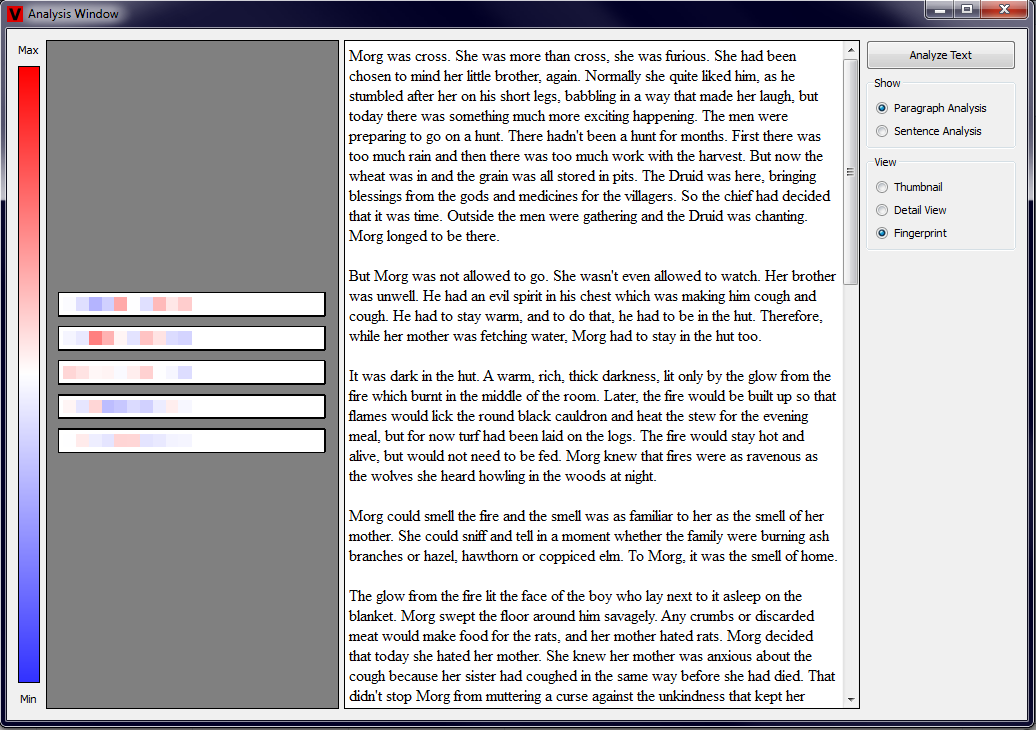
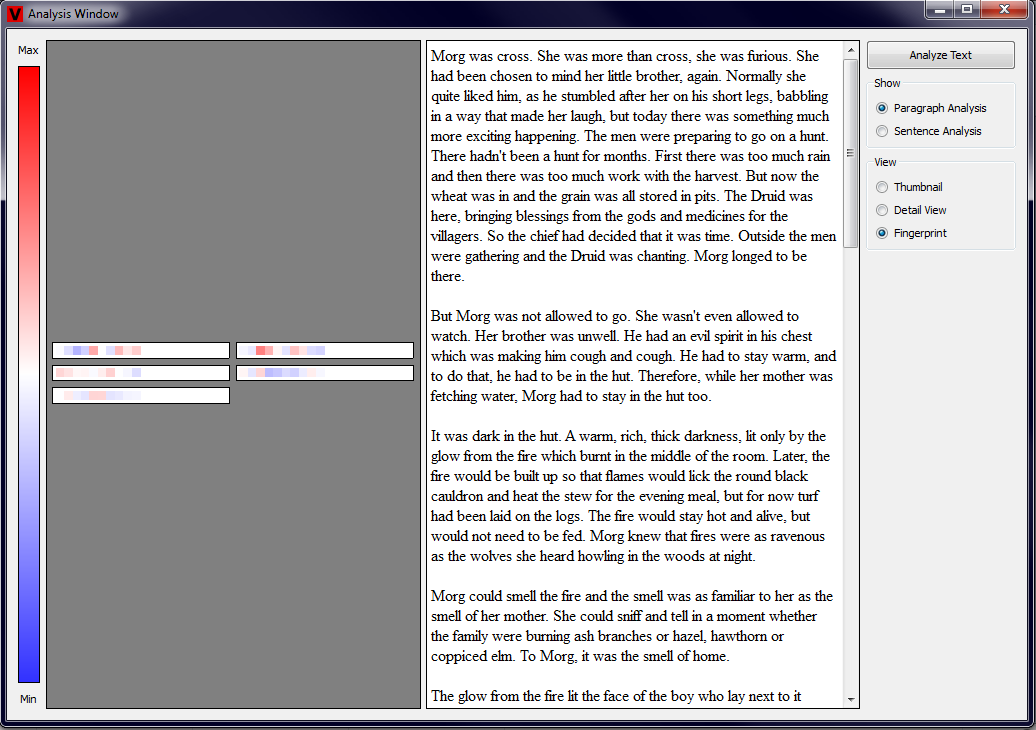
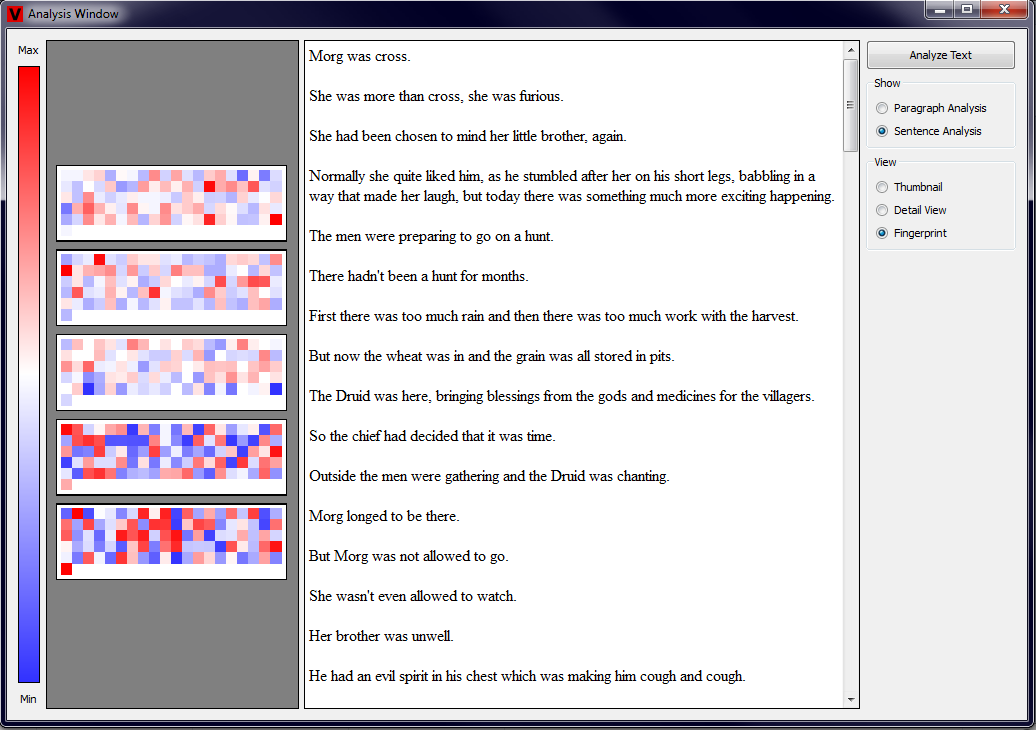
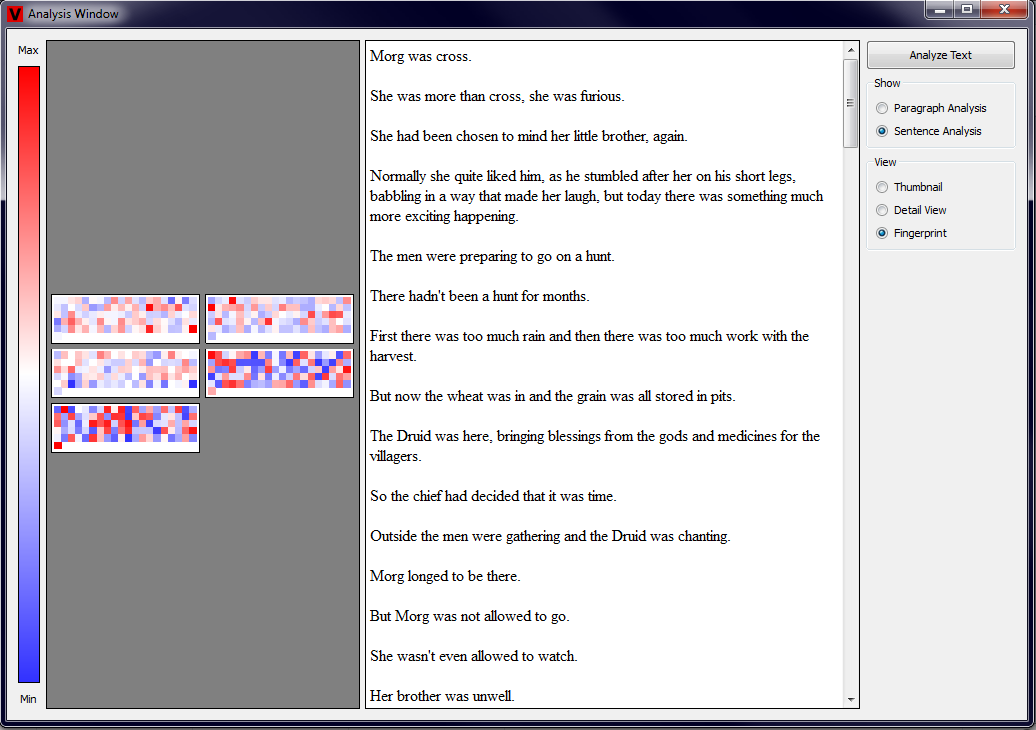
The last type of view that is implemented is the Fingerprint View. This visualization technique is the most concise one and it consists of five
large rectangles. Each of these rectangles corresponds to one of the measured properties. Further, each of the rectangles contains a set of small squares
that represent each of the paragraphs or sentences in the text. As always, the color visualizes the value of each measurement. This type of view should
provide the user a general impression of the text. We additionally implemented a functionality, that automatically scales the main rectangles in the
Fingerprint View. When the width of the Analysis View is above 300px, the rectangles are grouped such that always two of the rectangles are next to each
other. When the width of the Analysis View is below 300px, all of the rectangles are drawn above each other. Examples showing Fingerprints of paragraphs
and sentences in both forms are shown in the four pictures below (click to enlarge).
As we already mentioned in Section 1, we implemented only two statistical and one vocabular analysis methods. The remaining two
measurements are randomly created floating point numbers in the interval [0 1]. In this Section, we will shortly describe the implemented analysis methods.
Before the implementation, we evaluated the requirements on our application. The application can be divided into two main parts - the GUI and the program logic. The program logic involves purely the analysis of the text, and it is executed only when the Analysis Button is pressed. As this part does not need to be in real-time, we decided that we do not need to implement it using native code. The second important thing is, that the results of the analysis are displayed in the GUI. The visualization is purely of 2-dimensional character and therefore no API for 3-dimensional graphics like OpenGL or Direct3D needs to be used. As a result we chose to use Java in conjunction with a GUI Library called Qt Jambi. This GUI library is a port from C++ of the original Qt Library. It has a very extensive implemented functionality that in all aspects serves our requirements, and Java itself is a relatively easy language from the syntactical viewpoint. Qt Jambi additionally provides easy to extend functions and classes. We used this advantage for example to implement the highlighting of the text in the Thumbnail View.
[1] D. Oelke, D. Spretke, A. Stoffel, D. A. Keim. Visual Readability Analysis: How to Make Your Writings Easier to Read, IEEE Conference on Visual Analytics, Science and Technology 2010, October, 2010, pp. 123-130