StackGrapher
Purpose
StackGrapher is an implementation of some of the ideas proposed in Stacked Graphs - Geometry & Aesthetics by Lee Byron and Martin Wattenberg. Stacked graphs show a combined timeline of mutually exclusive time series. Originally developed to visualize trends in personal music listening, the authors were surprised by the strong reaction on information design blogs after the New York Times published a similar graph, reaching a wide audience in February 2008. An evolution of previous graph styles, the authors' contribution is to identify desirable properties of such graphs and to cast the issue of finding a baseline that minimizes the overall distortion within the graphs as an optimization problem.
Usage
After launching grapher.exe, load your custom time series via File / Open CSV File.... StackGrapher expects each line of the .csv to contain a text string (the description of the data in that line) followed by a list of numbers, all separated by commas. For example:
First Line,0.1,0.2,0.3,0.2,0.1,0.2,0.3,0.2
Second Line,0.3,0.2,0.1,0.2,0.3,0.2,0.1,0.2
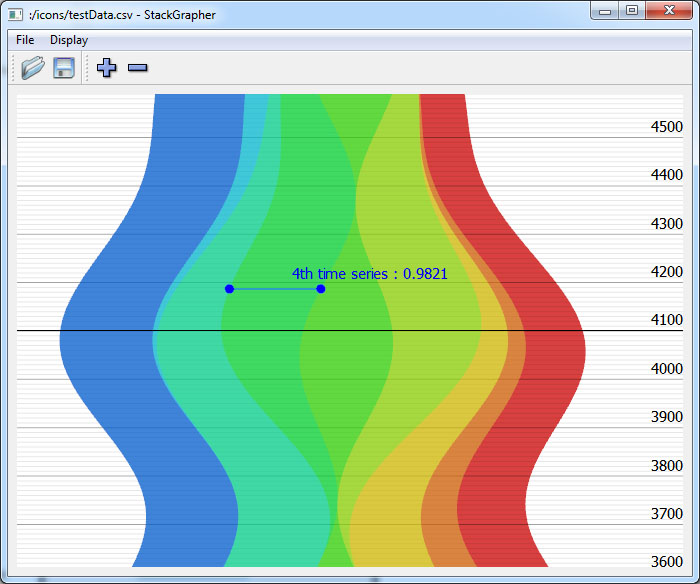
StackGrapher will draw a the stacked graph with minimal distortion. Use the mouse to navigate the graph:
- Left click + drag: horizontal pan
- Mouse wheel: horizontal zoom
- Shift + mouse wheel: vertical zoom
- Right click + drag: mark the selected area
- Double left click: center the clicked time in the window
- Mouse hover: read the graph values
The Display menu offers a few settings to customize the way the graph is being shown. If you want to save an image of your current view, select File / Save Image As....
Binaries
StackGrapher v1 (Windows, x86) - requires the Microsoft Visual C++ 2010 SP1 Redistributable Package (x86) to be installed.
Source Code
StackGrapher v1 - requires Qt 4.8 and GLEW to build. A Visual Studio 2010 project is included and installing the Visual Studio Add-in 1.1.11 for Qt4 is recommended. Building on other platforms may require small changes in the source code.
Source Code Documentation
Please see the design.txt file for a general overview of the program structure and refer to the commented source code for details.