This topic contains the following sections.
Welcome to CPCSilverlight!
This is an implementation of the Continuous Parallel Coordinate algorithm using Microsoft Silverlight.
Continuous Parallel Coordinates (CPC) is a visualization technique that aims to bring the advantages of continuous data to a visualization system that previously was only well suited for discrete data. The idea is to derive a density model for parallel coordinates for the visualization of spatially continuous input data.
You can find the original paper via the following link:
![]() Continuous Parallel Coordinates Paper
Continuous Parallel Coordinates Paper
In this section you will find information about our implementation, what's necessary to run it and how to use it.
Implementation
We implemented our CPC with Microsoft Silverlight 4, the .NET Framework 3.5 technology using Visual Studio 2010 Professional. Given the demands of the algorithm (data preparation, mostly static data exploration, little shadercode, ...), .NET and Silverlight seemed to be the perfect choice, allowing us to do all these things with simple and short code. An OpenGL/DirectX implementation would have taken much more coding effort on parts that aren't crucial to the actual CPC algorithm. Using the .NET Framework and its provided class library we could concentrate on the integral parts of our CPC implementation.
Due to a misconception on our part, we thought we had finished the application already a month ago. Two days before the submission deadline we however noticed that we hadn't implemented the CPC part correctly. Because of this, we only had time to implement one of the described ways to generate continuous parallel coordinates. We chose the Numerical integration approach by scattering lines with precalculated densities to generate the continuity.
Required Components
In order to run the software you need the following components installed:
- Windows XP or above, Mac OS X or above
- Silverlight compatible browser: latest versions of Internet Explorer, Firefox, Safari or Opera
-
Microsoft Silverlight 4 Runtime or above: You can grab the current version
 here
here -
Microsoft .NET Framework 3.5 SP1 Runtime or above: Grab the current version
here
Since Silverlight is a web-application and we expect you do not want to host it inside an actual IIS webserver, we suggest you simply start it from inside Visual Studio 2010. In order for this to work, you need to have the following Tools installed:
- Visual Studio 2010 incl. Service Pack 1
- Silverlight 4 Tools or above
- Silverlight 4 SDK or above
- Optional: If you want to debug it, you need to get the Silverlight Developer Runtime (either x86 or x64 based on your OS)
Also make sure you are always using the same version of the various Silverlight requirements mentioned above. So if you are installing the Silverlight 5 Tools, make sure that you are also installing the Silverlight 5 SDK as well as the Silverlight 5 (Developer) Runtime. Mixing these tools is not recommended.
Run the example from a preinstalled webpage
You can find an up and running version under the following link:
![]() CPCSilverlight webpage
CPCSilverlight webpage
Running the example from Visual Studio
Open up Visual Studio and load the ParCoords solution. If everything is installed correctly you should be able to simply run the demo by pressing F5 or using the menu "Debug" -> "Start (with or without) Debugging".
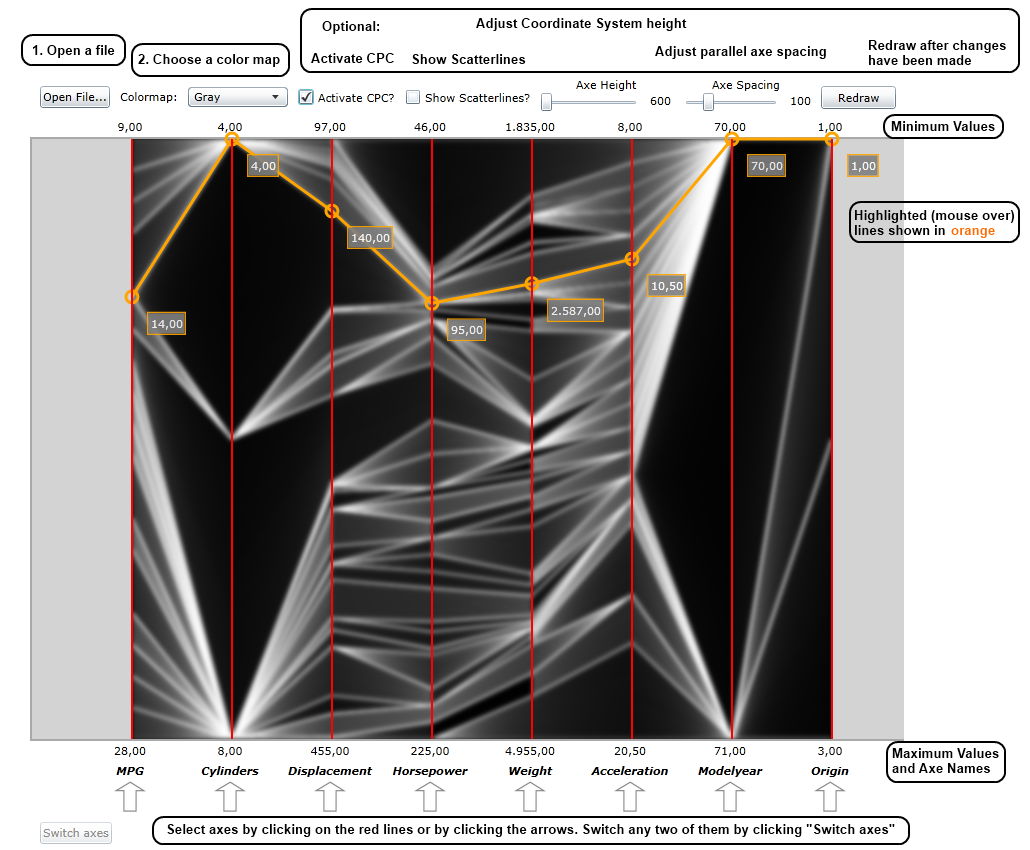
In the above image you can see the basic workflow when using TreePlusSilverlight. Lets outline the steps to get you started:
- Click on the Open file... button and choose one of the provided cars.csv files.
- When the loading process finishes, you should see the parallel coordinate system with the datalines displayed in dark-gray color. If you move your mouse cursor over a dataline it gets highlighted in orange and displays its actual values.
- You can then Activate CPC to show the CPC effect, or Show Scatterlines by clicking the respective checkboxes.
- More on the UI can be found in the next section.
GUI Interface
At the top of the screen you have the control area. This is where you can control what and how the content is presented to you.
- Open File...: Loads a new dataset from a CSV-file.
- Colormap: Lets you choose one of four possible colormaps in which you want to display the CPC-effect.
- Activate CPC: Toggles the display of the CPC effect. If activated the normal parallel coordinate system is replaced by the CPC system. You can still highlight actual datalines by moving your mouse over them.
- Show Scatterlines: A debug feature that allows you to display the scattered lines that are used to generate the CPC effect.
- Axe Height: Allows you to change the actual height of the parallel coordinate system. You need to click Redraw in order for the changes to take effect.
- Axe spacing: Allows you to change the horizontal spacing between adjacent axes. You need to click Redraw in order for the changes to take effect.
- Redraw: Redraws the entire parallel coordinate system.
Below the control area is the Canvas. At the top of the canvas you will see some numerical values displayed, that represent the minimum values the respective axe is currently displaying. Below is the actual parallel coordinate system. Underneath that you will again find some printed values, marking the maximum values the respective axe is currently displaying as well as the axe names in bold.
On the bottom of the screen you have arrows underneath each of the axes. These allow you to select at most two of the axes at the same time and then by pressing the Switch axes button to switch these axes. The UI is automatically redrawn.