Manual
As of the current version, our application is able to read .jpg and .png image sequences, that represent frames of a video. To generate a new visualization, click the Open directory button or hit the key O.
Note: See all available shortcuts in the About window (heart button).
After choosing the data source, you specify settings for the image sequence like the downsampling factor or the frame rate (i.e. every n-th frame, which should be processed).
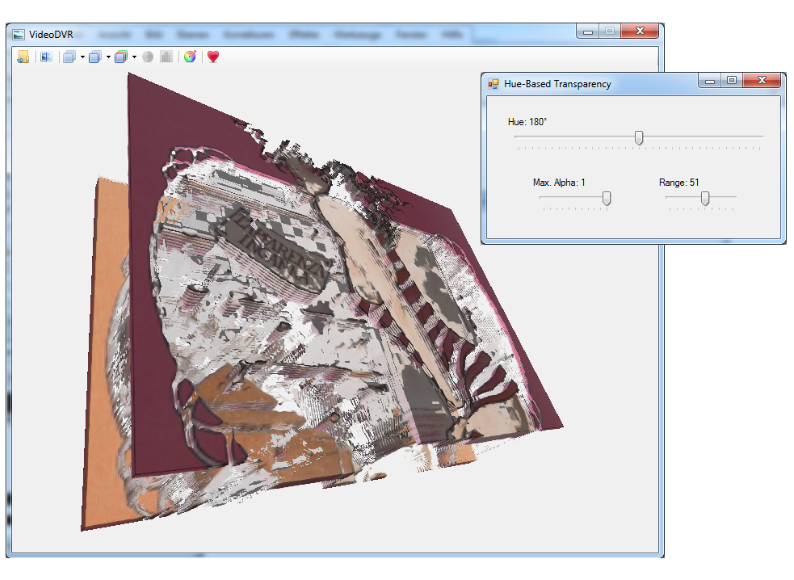
The rendered video sequence is displayed in the main window. You can rotate the volume with the mouse and zoom in and out with the mouse wheel. The Slice Selector window enables the user to browse through the volume by selecting a slice with the slider. By changing the Context, you can define, how many percent of the volume are displayed in both directions of the selected slice.
By clicking the Display Video Volume button you can switch between two different transparency modes. In Constant Transparency mode, the volume is displayed with alpha = 0.5. When selecting Hue-Based Transparency, you can specify a hue-based transfer function in a seperate window. By changing the Hue and Range sliders, the range of the rendered hue is defined by: [hue - range/2, hue + range/2]. The maximum value for alpha in the rendering can be changed as well.
Difference metrics
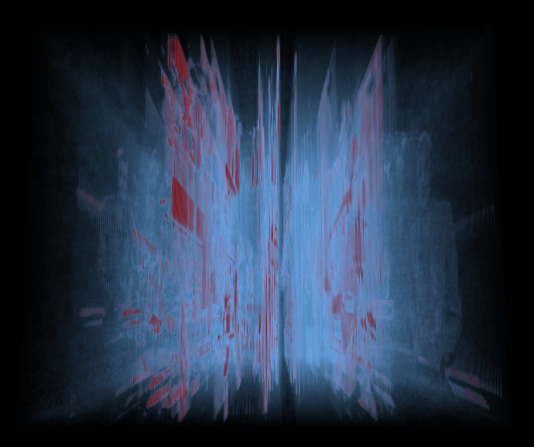
In order to show changes/activity in the video, you can apply difference metrics on the volume data. You can choose between the difference to a reference frame or frame difference in the video. For both modes exist three different metrics:
- Y-DIF: This simple difference metric calculates the linear distance between the Y-values of two corresponding pixels (in two images).
- Y-MSE: Instead of computing the linear distance, the squared distance is calculated.
- UV-DIF: This colour difference metric calculates the angle between the UV vectors of two corresponding pixels (in two images). The corresponding pixel in the output is set to the angle.
Transfer Functions
In order to visualize the changes calculated with the difference metrics, you can define transfer functions for the rendering of a difference volume. In the Transfer Function window you can specify a new function by clicking into the grid. You specify a new color and alpha value for the input alpha values. The x-axis represents the input alpha values and the y-axis the new values. The resulting transfer function is shown in the right panel and rendered immediately.
Graphs
When rendering difference metrics, the user can obtain detailed information about the intensities in the difference volume. By clicking the Show Graph button, a graph with the mean pixel intensities per slice is displayed. If you find a region of interest, you can choose a slice by clicking into the graph. The Slice Selector automatically browses to the selected slice in the volume. The graphs also act as supporting tool for the definition of transfer functions.
Code and Documentation
You can view and download the source code here. The documentation is available here: HighGL and VideoDVR.