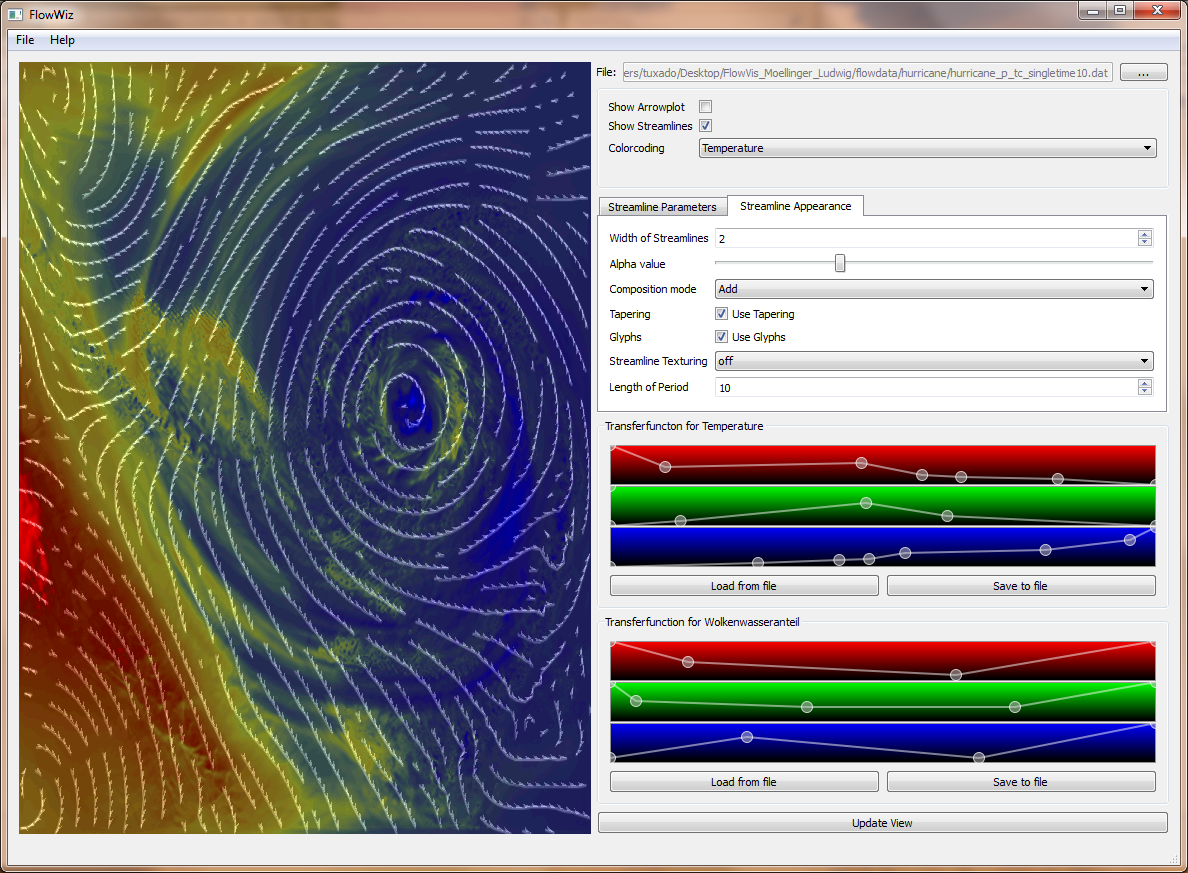
With the provided application flowdata can be displayed and explored.
We developed a software capable of visualizing flow datasets as an end-user application with intuitive interaction possibilities. Thanks to C++, OpenGL and Qt (qt.nokia.com) it is also a cross-platform application.
Data can be loaded by using File -> Open. A file dialog will pop up and let you choose one of the *.dat files. By confirming the file dialog the data gets loaded. Flowdata is processed.
The user has the choice between a lot of options how the final result will be composed and look like by varying GUI parameters.
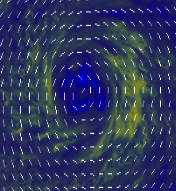
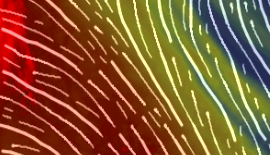
An arrowplot can be enabled and disabled that shows the two dimensional flowvectors.
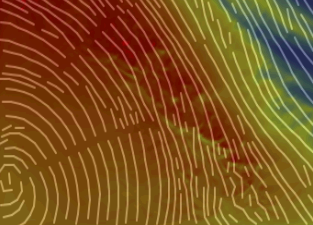
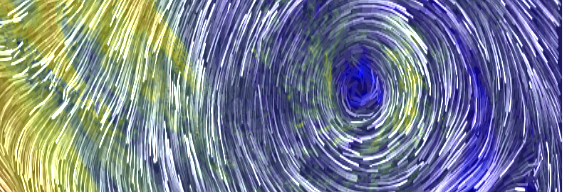
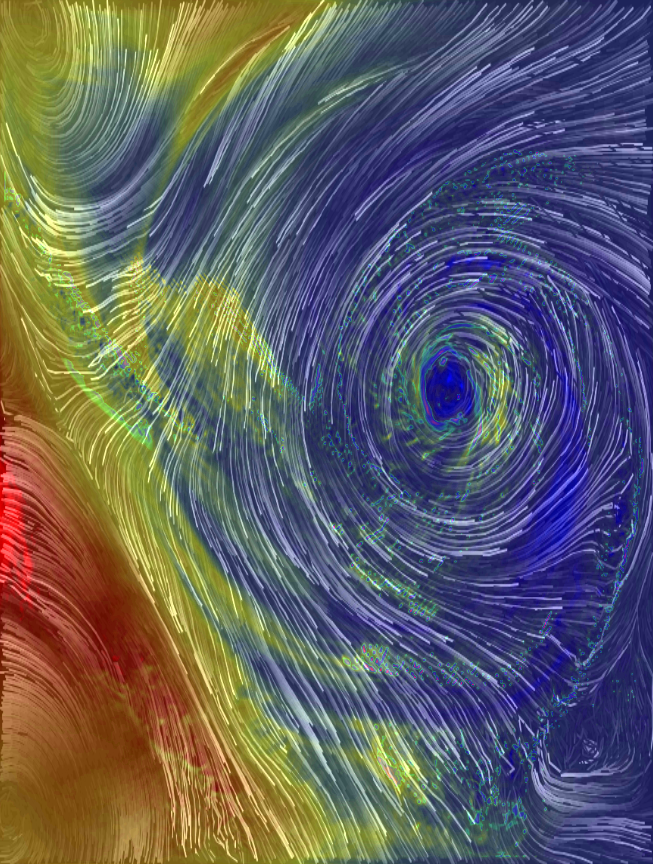
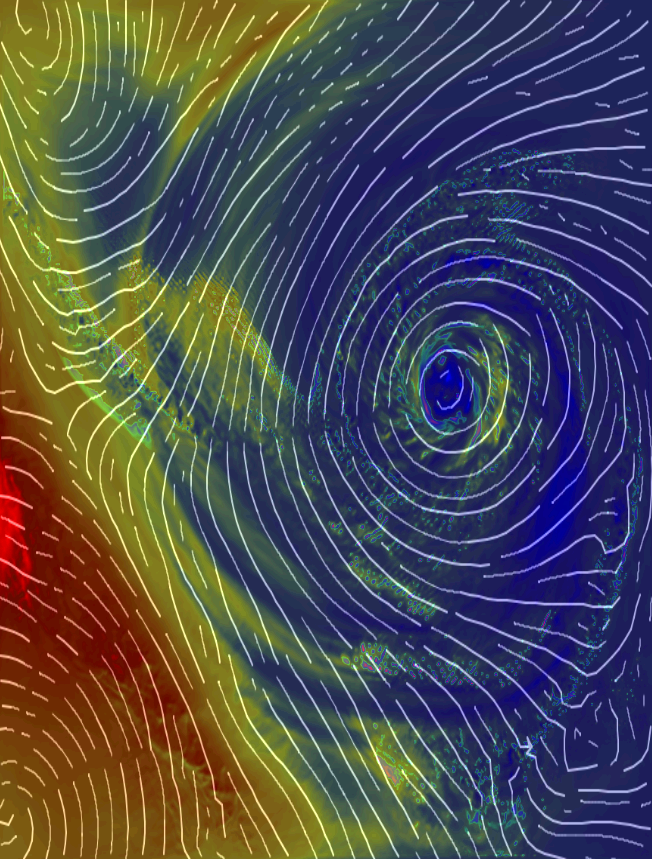
Based on the scientific paper [1] we implemented an "evenly spaced streamlines" algorithm. By varying parameters in the "Streamline Parameters" TAB you can change the visual output.
We implemented 3 integration methods:
These parameters influence the streamline appearance:
With the "Alpha value" slider you can make streamlines more transparent if you want or also make them black by changing the "Composition Mode" from "Add" to "Subtract".
Glyphs can be switched on and off. Those glyphs can be combined with streamlines and can also be made transparent with the "Alpha value" slider.
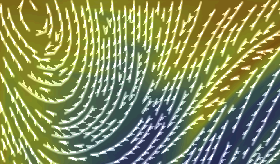
Tapering can be switched on and off. Tapering influences the thickness of streamlines. If a streamline is close to another streamline it will be drawn thinner at this position.
I streamlines come very close because of a small parameter D sep it is hard to distinguish them. Therefore we implemented a texturing technique for streamlines like presented in the scientific paper.
There are 3 available Options from the dropdown menu "Streamline texturing":
By varying the "Length of Period" parameter you can achieve different results in both formula modes.
Additional channel data can be displayed by color coding the output window and using transferfunctions. You have the choice between displaying only 1 addional information or displaying both at the same time. Streamlines, glyphs, arrows and so on will always be displayed as an overlay to his color coded information.
With 3 RGB and one transparency widget it is very easy to define complex transferfunctions. You can define two transferfunctions: "transferfunction 1" will be used for the first addional scalar field data that can be selected in the TAB "Options" in the dropdown box "colorcoding". "Transferfunction 2" will be used for the second additional scalar field data respectively. By clicking into the widget you can add aditional controlpoints. Control points can be dragged by holding the primary mouse button. To delete a controlpoint hover over it and simply press secondary mouse button. For everything you do you will get instant feedback in the rendering view to your left.
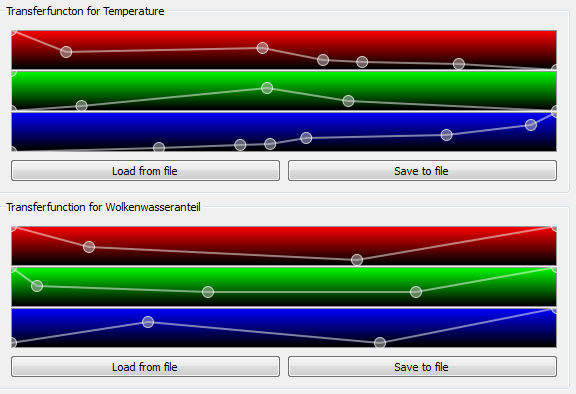
Transferfunctions can be saved and loaded into a .tff file at any time with the "Load from file" and "Save to file" buttons.
You can download:
This page is valid XHTML/CSS and written by Christian Möllinger and Wolfgang Ludwig.
Sourcecode documentation was created with Doxygen.
This application was created based on:
[1] Bruno Jobard and Wilfrid Lefer, "Creating Evenly Spaced Streamlines of Arbitrary Density", Visualization in Scientific Computing '97, Springer Vienna, 1997, pp. 43 – 54.