Visualisierung LU WS 2008/09 - Flowvisualization
Groupmembers
Johannes Novotny, 0325101
Georg Schleicher, 0326261
Features
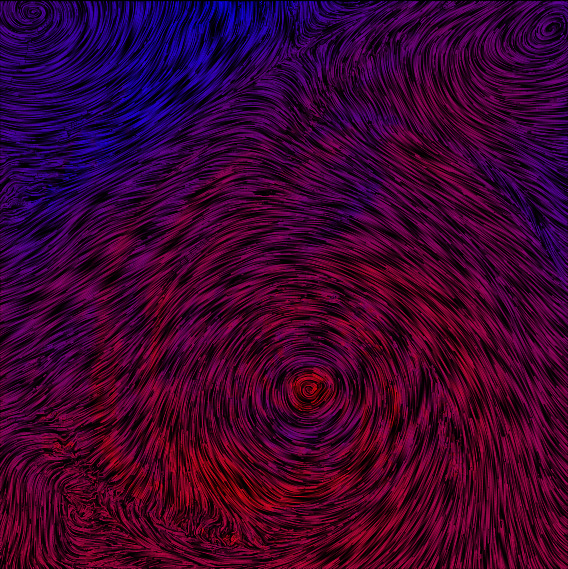
- texture representation
- arrow plot
- evenly spaced streamlines
- autosaved editable Transferfunctions
- Euler-/Runge-Kutta integration
- tapering effect
- glyph mapping
- "texture" line coloration
GUI Tutorial
Loading a FlowDataset
Push the "load FlowData" button. Search for a dataset .gri file with the file browser and click the open button.
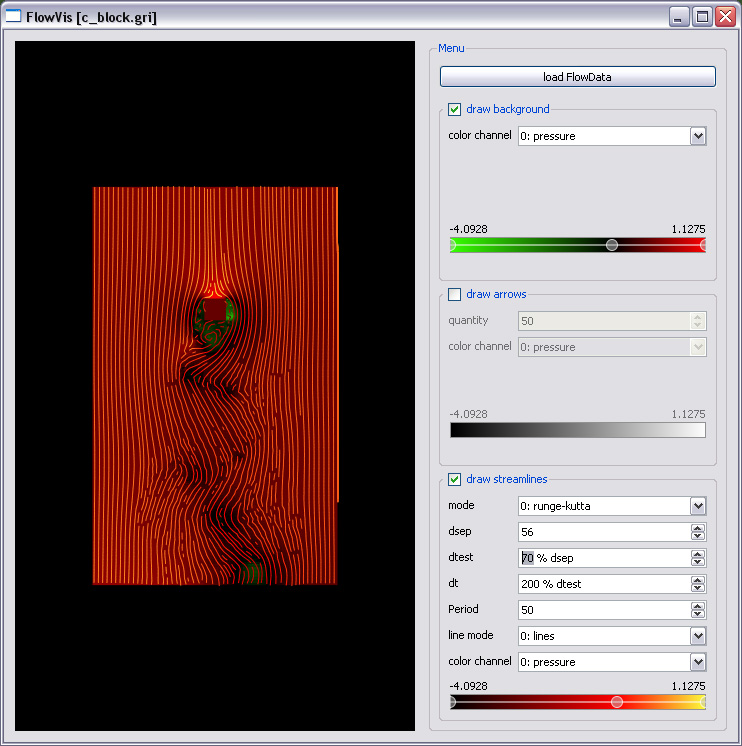
Draw background
activates the texture representation.
Color channels
specifies which of the additional data channels should be used with the transferfunction.
Transfer function: creating a new point
Right click on the position where you want to create a new point and choose "new point" (is only possible if there is no point at that position).
Transfer function: deleting a point
Right click on a existing point and choose "delete point".
Transfer function: change the color of a point
Right click on a exsisting point and choose "set color".
Transfer function: saving the current color and alpha points
The points get saved automaticly each time they change.
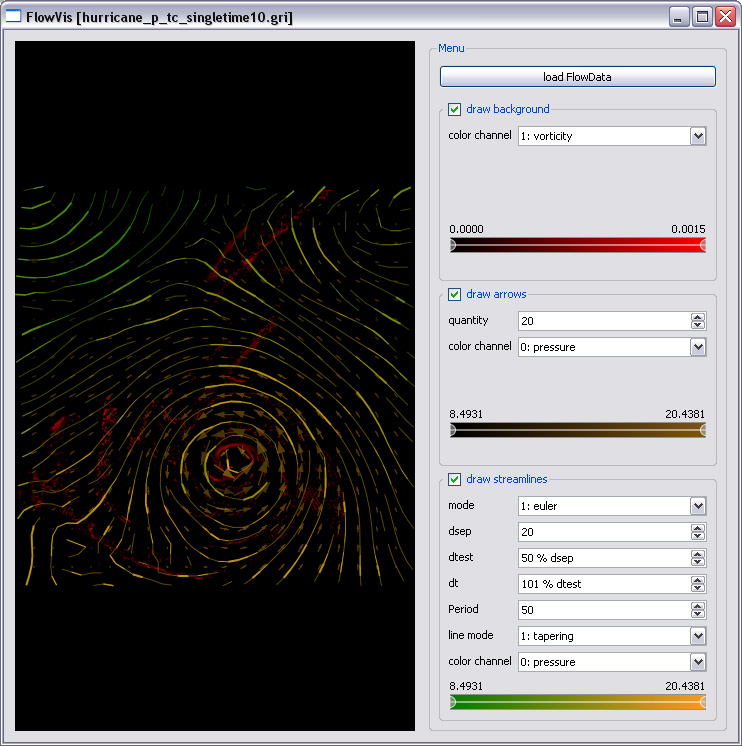
Draw arrows
activates the arrow plot.
Quantity
specifies the number of arrows plotted in direction of the larger dimension fo the dataset.
Draw streamlines
activates the streamline representation.
Mode
specifies the integration method, Runge-Kutta or Euler.
dsep
the seedpoint separation distance of the streamline algorithm.
due to different dataset sizes it is calculated relative to the smaller dimension of the dataset (sidelength/dsep).
dtest
the minimal allowed streamline distance, realtive to the separation distance.
dt
the steplength used by the integration, realtive to the testdistance.
Period
the periodlength used by the intensity function in texture line mode.
Line mode
- line: normal streamlines
- tapering: "handdrawn" style
- glyph: mapping of halfarrow glyphs
- texture: activates texture intensity function, recommended at high dsep values
Screenshots
Documentation
Downloads
![]() Documentation
Documentation
![]() Binaries x86
Binaries x86
![]() Binaries linux (requires Qt4 and Glew)
Binaries linux (requires Qt4 and Glew)