
This page describes FlowVis, a program for flow visualization, providing the user with several techniques for viewing complex fluid flow.
It is written in C++, OpenGL, using the rich feature set offered by wxWidgets, a
cross-platform GUI and tools library for GTK, MS Windows, and MacOS.
The application is compiled for use with Windows 2000 or Windows XP (32bit). A recent graphics card like a GeForce 7 - 8 is required.
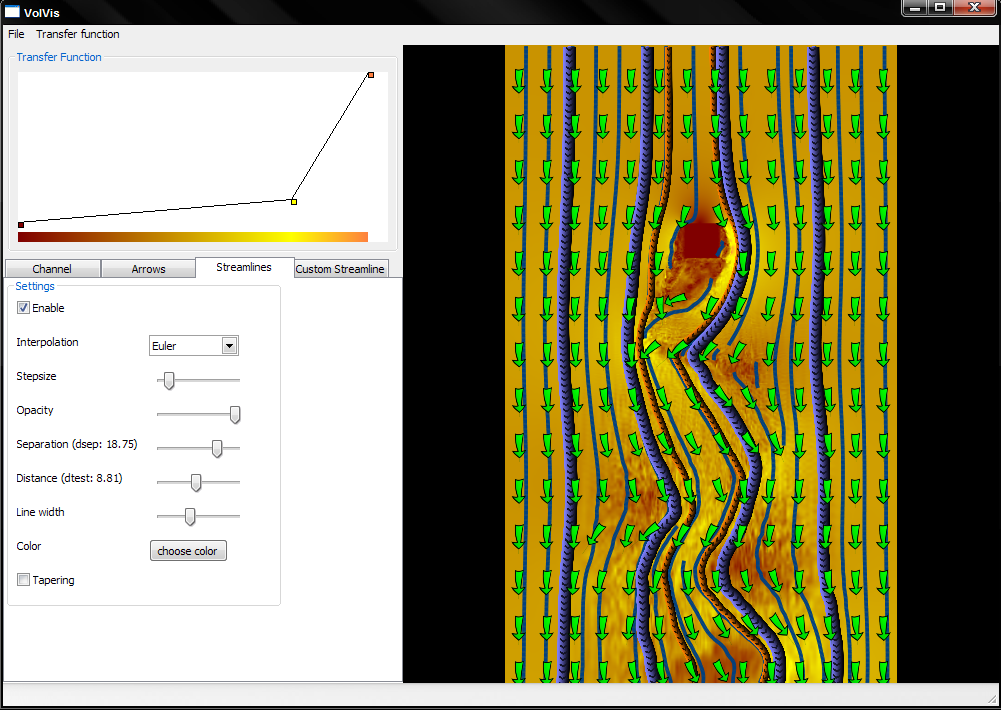
The User Interface is divided into the Main Menu Toolbar, the Viewport, the Property Editor and the Transfer Function Editor
- The Main Menu Toolbar
The entries found in the main menu toolbar are File and Transfer Function.
- File/Load - allows for loading a new dataset.
- File/Export Image - lets you grab a screenshot of the viewport and save a image to disk.
- File/Quit - exits the application
- Transfer Function/New - resets the transfer tunction specification
- Transfer Function/Load - allows for loading a previously saved transfer function specification
- Transfer Function/Save - saves the current transfer function specification
- File/Load - allows for loading a new dataset.
- The Viewport
The viewport is a resizable OpenGL widget which shows the rendition and allows for interactive manipulation such as zooming and panning the data.
LMB down and dragging, pans, using the mouse wheel zooms. RMB click resets the view.
- The Property Editor
The property editor below the transfer function editor groups related properties into tabs.
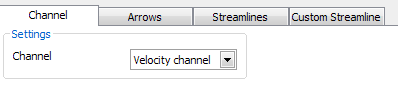
- The Channel Tab
allows for selecting different channels from the flow dataset. Each dataset consists of a velocity channel and several other additional channels.
Each channel corresponds to a transfer function which offers the possibility to assign colors to channels values. The transfer function handling is
explained later in the section "The transfer function editor".
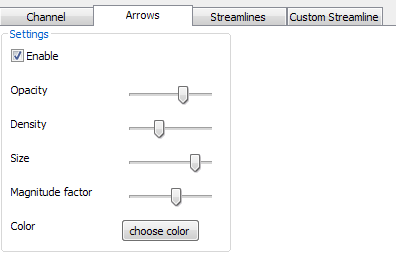
- The Arrows Tab
provides the settings for controlling the display of an arrow plot. While most of the settings are pretty self-explanatory the slider
named Magnitude factor controls to what degree the arrow size is modulated by the data velocity magnitude.
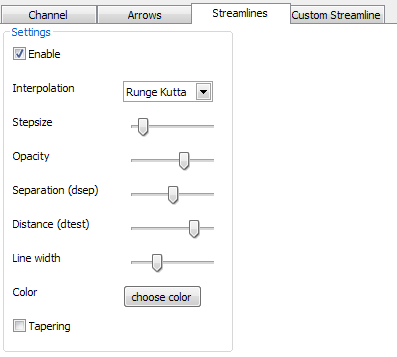
- The Streamlines Tab
allows to set parameters for creation and rendering of evenly spaced streamlines. With the select box Interpolation, the interpolation method can be set to either Euler or Runge Kutta and the interpolation stepsize can be varied with the slider Stepsize. The sliders Separation (dsep) and Distance (dtest) allow to control how close streamlines can lie to each other. Where Separation (dsep) controls the seed point distance (the start point of new streamlines during the generation process) and Distance (dtest) how close the streamlines can get during the interpolation of a streamline. In order to show the streamlines with decreasing line thickness on their ends, as they get closer to each other, enable the checkbox Tapering.
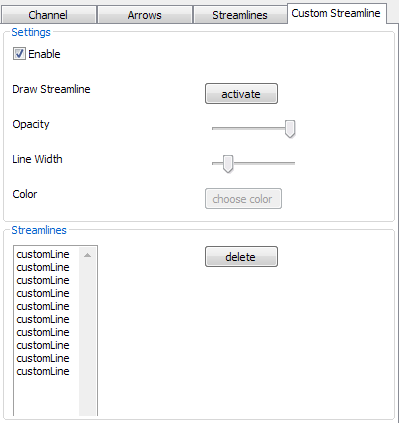
- The Custom Streamline Tab
allows for placing custom streamlines in designated places. In order to start an interactive placement session push the activate button. The viewport is reset and a border surrounding the data indicates that viewport manipulation is deactivated. In this mode LMB click starts bidirectional streamline integration starting from the clicked point. The three widgets Opacity, Line Width and Color, which become available in this mode, control the visual appearance of the next streamline placed. Each new streamline is inserted into a list and can be deleted by selection and pushing the delete button. Common multiple selection, using CTRL and SHIFT is supported.
-
The Transfer Function Editor
offers the possibility to assign colors to the channel values of the actual channel selected in the property tab Channel. Each channel corresponds to a separate transfer function and can be manipulated independently. Reset, load and save a transfer function with the main menu entry Transfer function. Use the left mouse button to place new keyframes in the editor window and move them by dragging with a pressed left mouse button. To change existing keyframes press the right mouse button over an keyframe and choose in the context menu Color to change the color value or Delete to remove them.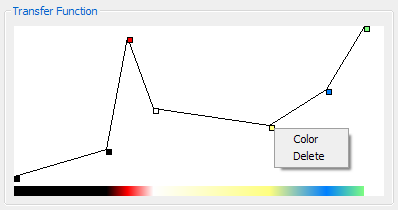
The main features of FlowVis are:
- Arrow Plots
- Set color, opacity and size of the arrows.
- Set arrow size according to velocity magnitude
- Color Coding
- Interactive transfer function
- Independent transfer function for each channel
- Evenly Spaced Streamlines
- Set color, opacity and line width for the streamlines
- Set Euler or Runge Kutta method and stepsize for interpolation
- Set dsep and dtest parameter
- Tapering
- Custom Streamlines
- User can place custom streamlines.
- Set color, opacity and line width for custom streamlines
- General
- Navigate the flow dataset per mouse
- Export to several image formats.

Robert Hausmair (e9709998@student.tuwien.ac.at), Christoph Winklhofer (e0426461@student.tuwien.ac.at)
Technical University Vienna, Austria