|
|
Flow Visualization |
Bilal Alsallakh, (00627567)
Jana Banova, (e0326272)
TU Vienna, Winter Semester' 07
Based on:
Bruno Jobard, Wilfrid Lefer "Creating Evenly-Spaced Streamlines of Arbitary Density"
Table of Contents
Introduction
The purpose of this work is to implement the Evenly-Spaced Streamlinens algorithm for 2D flow data visualization. It implements a method to compute a wide variety of flow field images ranging from texture-like to hand-drawing styles. It enables user interaction for setting parameters such as density, transfer functions, etc.
Flow visualization through streamlines is a relatively easy approach to improve understanding of flows. This Java application is implemented in software and therefore can be used by a wide range of users due to its independence from graphic hardware or OS type.

Fig.1. The main screen of the program
User Guide
Hardware Requirements:
-
A color graphic card
-
Free memory of at least twice as large as the size of the volume dataset.
-
A color screen
-
Mouse or equivalent (can´t be controlled by keyboard only)
As you can see from Fig. 1 the control panel on the left side is divided into 6 areas:
In area 1 are basic buttons for:
(from left to right)
1.1. loading data sets (OPEN button)
1.2. saving current visualization to image file (SAVE IMAGE button)
1.3. zooming in and out with buttons +(in) and - (out)
1.4. BLUR checkbox for enabling or disabling the blur function (meant to be used when creating a texture image)
In area 2 are basic settings for drawing channels:
2.1. channel combobox for selecting current chanel you want to visualize
2.2. transfer function for changing colors which code the channel values
(NOTE: one click will add a point to the transfer function, by double clicking you can change the color)
2.3. Draw channel checkbox to enable or disable drawing channels
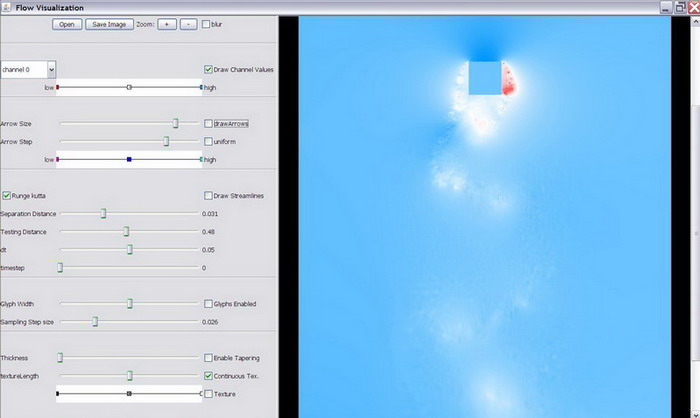
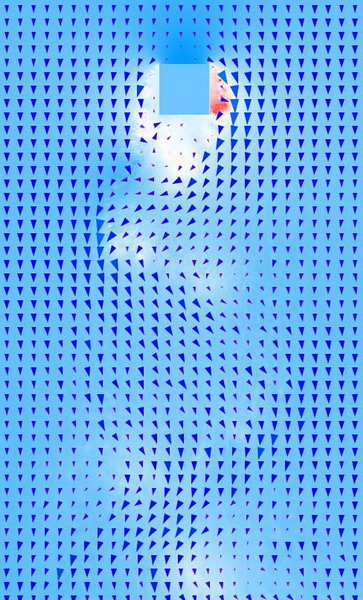
In area 3 are basic settings for drawing arrows:
3.1. arrow size slider
3.2. draw arrows checkbox to enable or disable drawing arrows
3.3. arrow step slider for changing size of the arrows
3.4. uniform checkbox for enabling or disabling normalization of arrow size
(NOTE: while disabled, the arrows will be scaled by the local flow velocity)
3.5. Transfer function for changing colors of the arrows depending on flow velocity (NOTE: one click will add a point to the transfer function, by double clicking you can change the color)
|
|
|
In area 4 are basic settings for drawing streamlines:
4.1. Runge-Kutta checkbox applies Runge-Kutta integration during streamline generation
(NOTE: while disabled, Euler integration is used)
4.2. draw streamlines checkbox to enable or disable drawing streamlines
4.3. separation distance slider for changing density of the streamlines
4.4. testing distance slider sets the minimal distance under which the integration of streamlines will be stopped. Low testing distance produces long streamlines.
4.5. dt slider sets integration stepsize
4.6. timestep slider allows you to view the given time frame of the loaded data.
|
|
|
|
|
|
In area 5 are basic settings for drawing glyphs:
NOTE: this feature works only if you have positive check in 4.2. checkbox(draw streamlines)
5.1. glyph width slider value gives a percentage of separating distance(see 4.3.)
5.2. Glyphs enabled checkbox to enable or disable mapping glyphs to the streamlines to visualize the direction of the flow
5.3. sampling step size slider sets the length of lines, the streamlines are created from
(NOTE: this value can be understood as glyph lenght but it also influences streamlines if the value is high, the streamlines will be angular)
|
|
In area 6 are basic settings for textures and tapering:
NOTE: this feature works only if you have positive check in 4.2. checkbox(draw streamlines)
6.1. thickness slider will set the thickness of the streamlines, in case you have enabled tapering first(see 6.2.)
6.2. enable taphering checkbox to enable or disable taphering of the ends of streamlines
6.3. textureLenght slider will change the length that is mapped on the streamlines
6.4. continuous texture checkbox will generate a smooth continuesly increasing and decreasing gradient texture. When disabled the texture generator will produce discontinuous segments of increasing intensity in order to remove ambiguitues about the orientation of the flow.
6.5. transfer function for changing colors of the texture gradient
6.6. texture checkbox will enable or disable the texture mapping
|
|
|
|
|
|
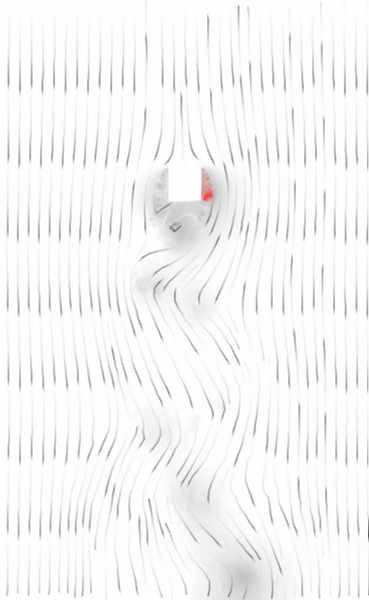

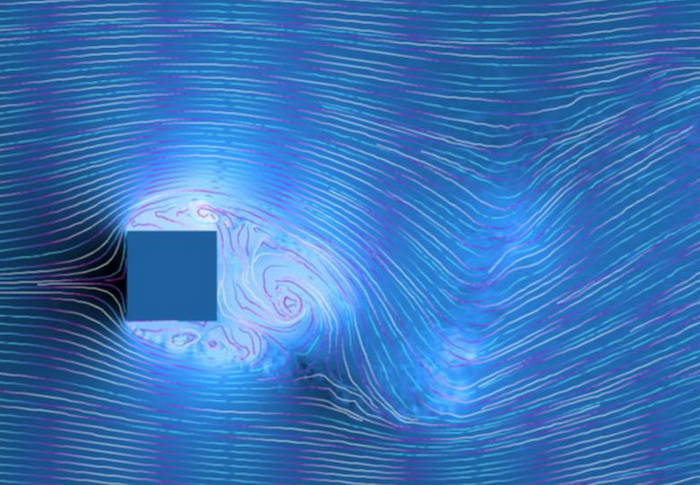
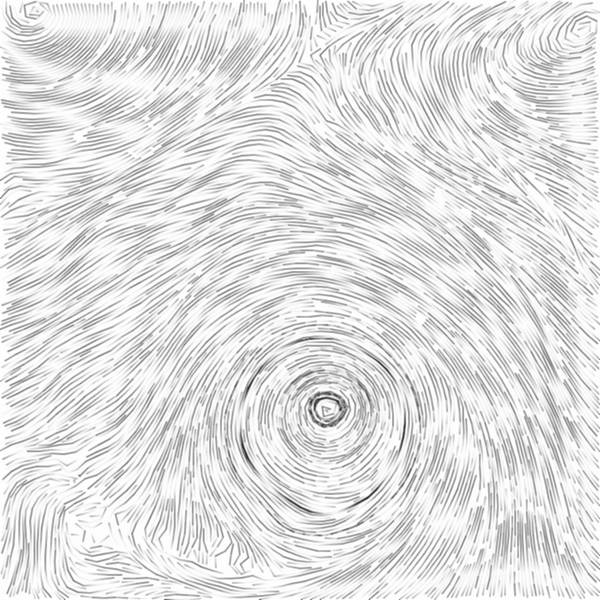
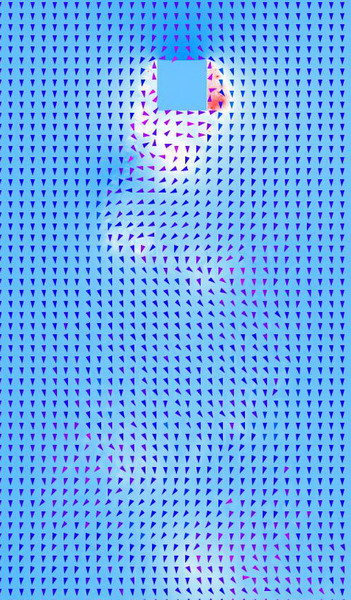
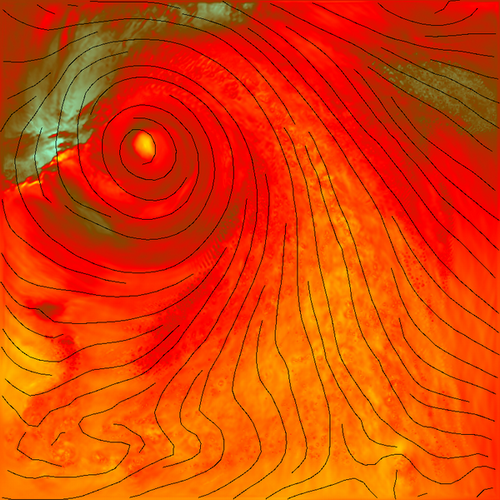
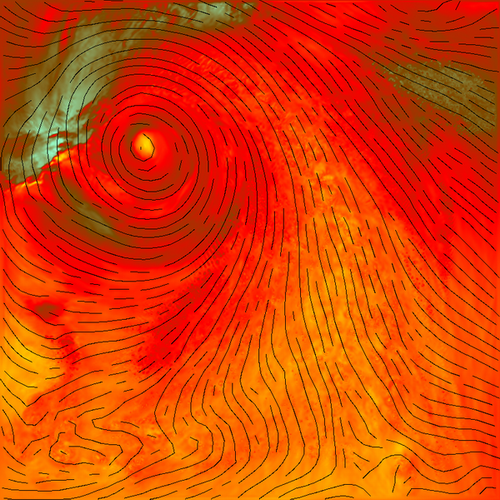
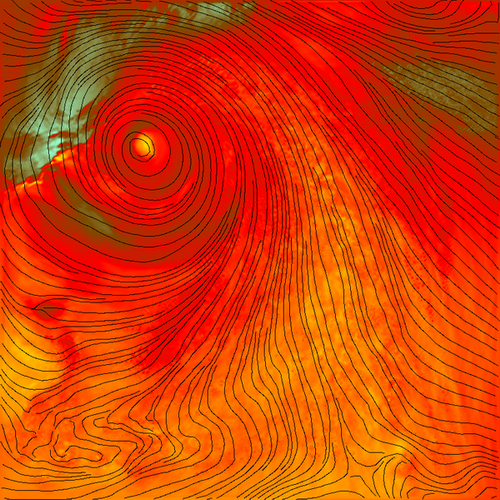
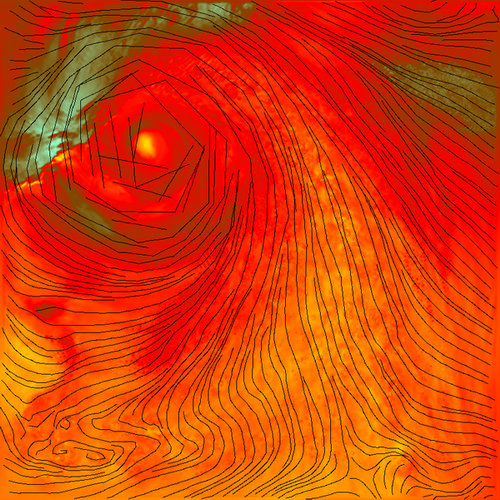
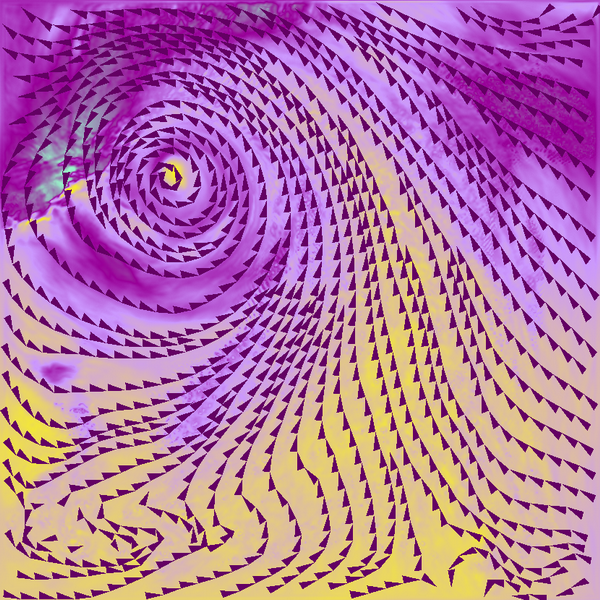
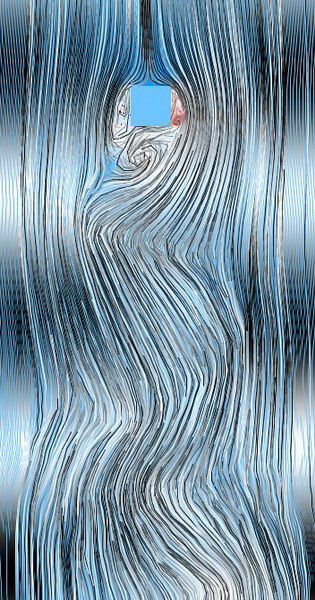
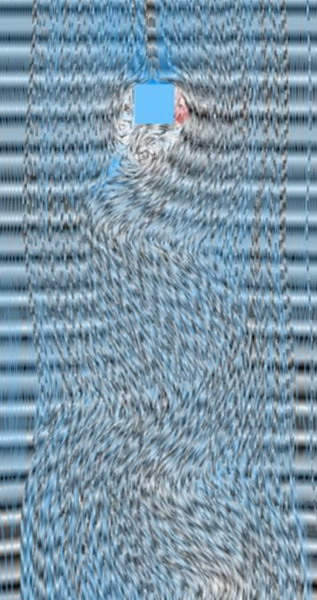
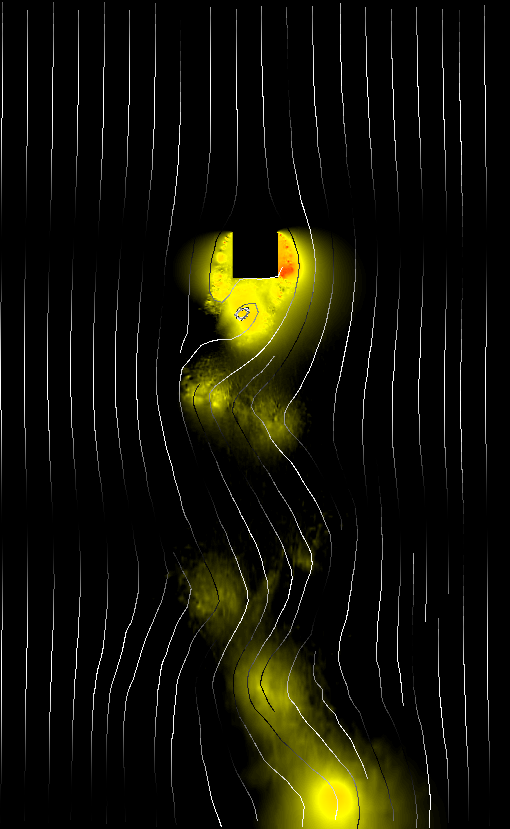
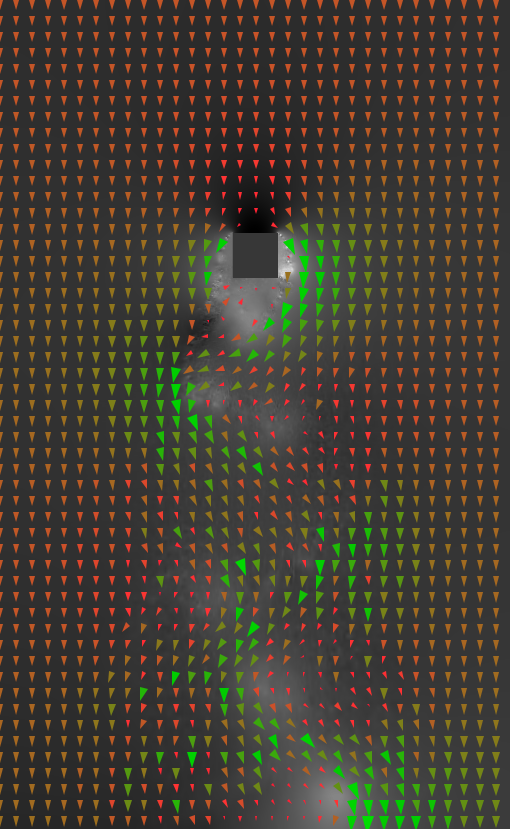
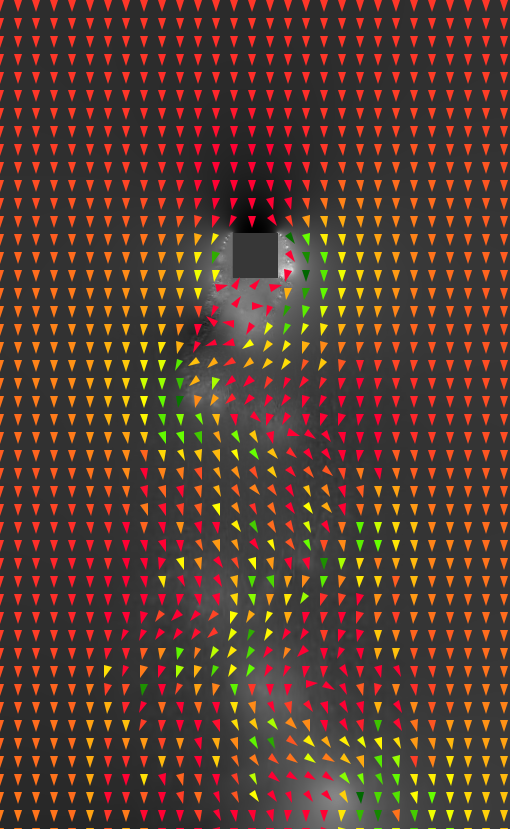
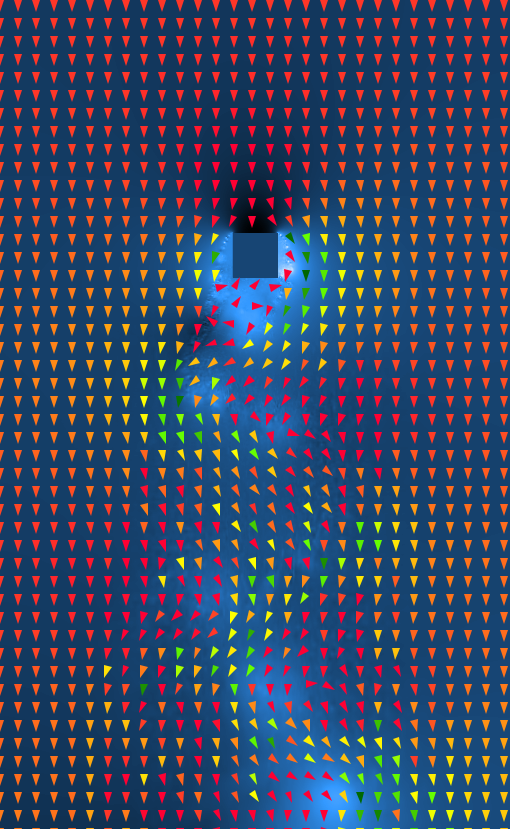
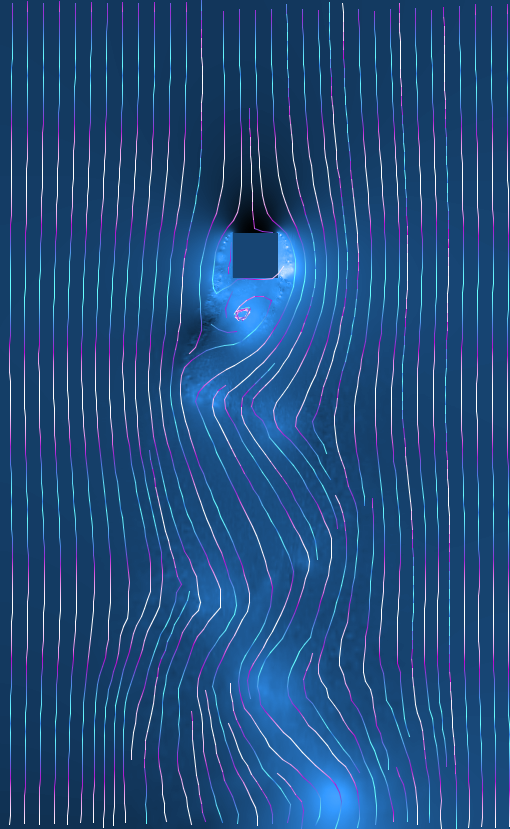
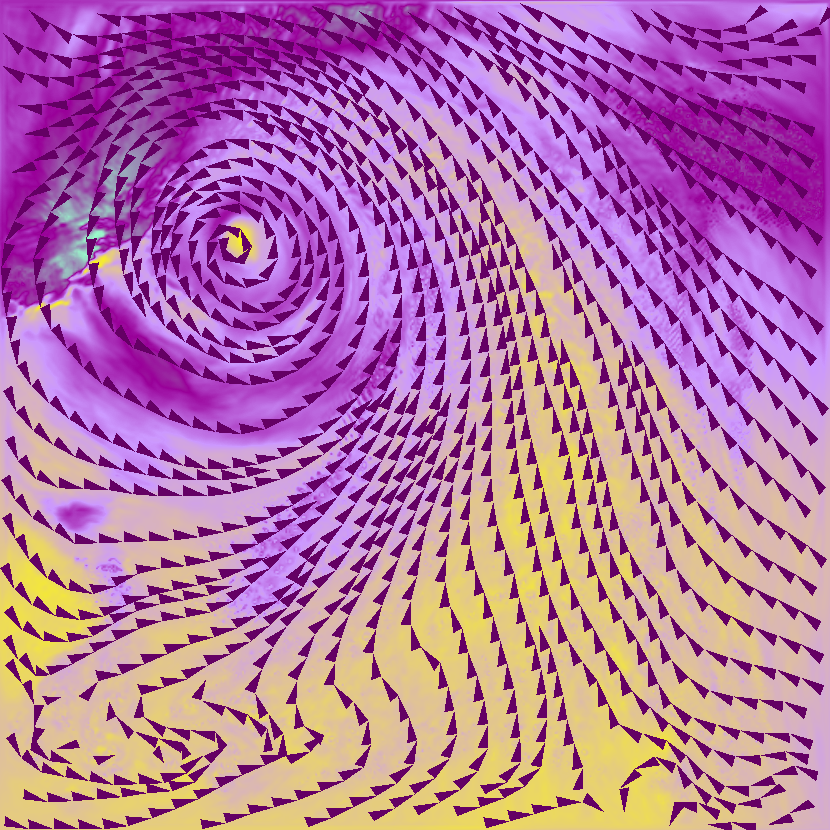
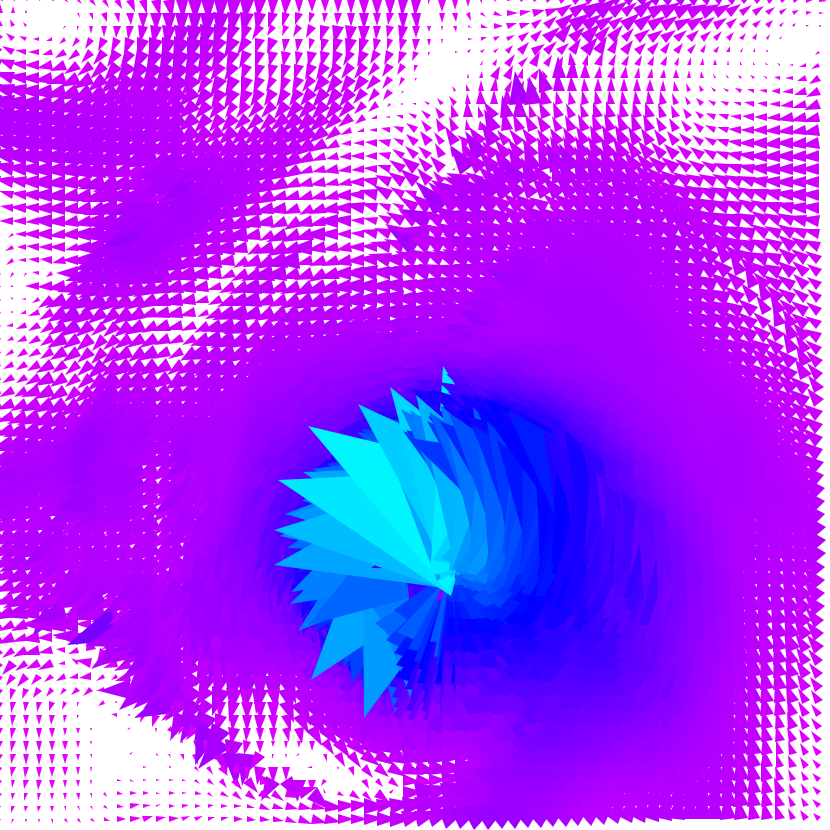
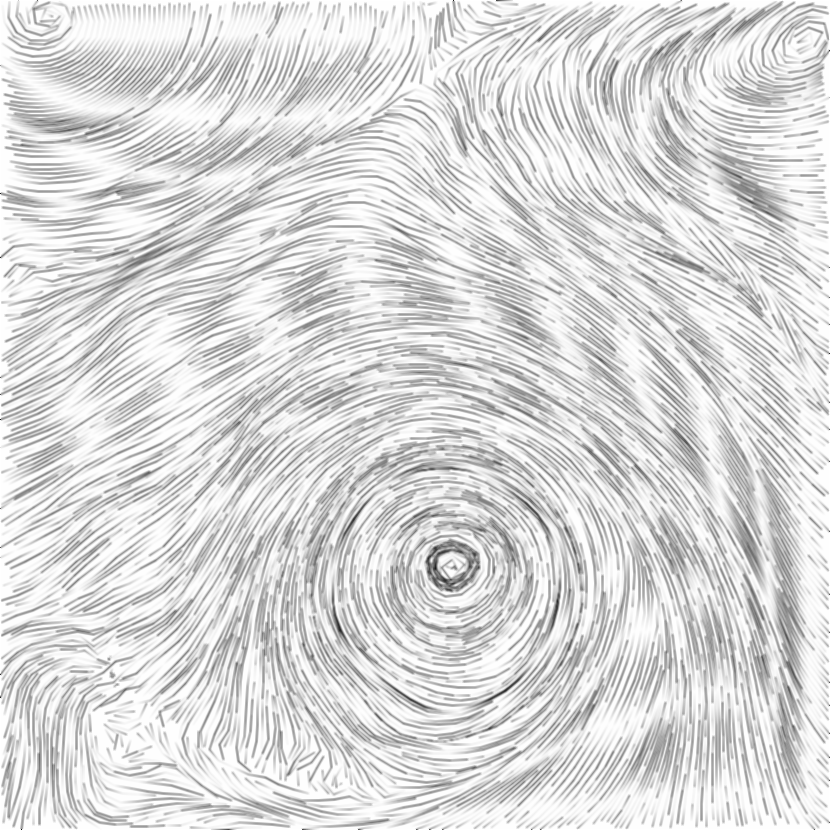
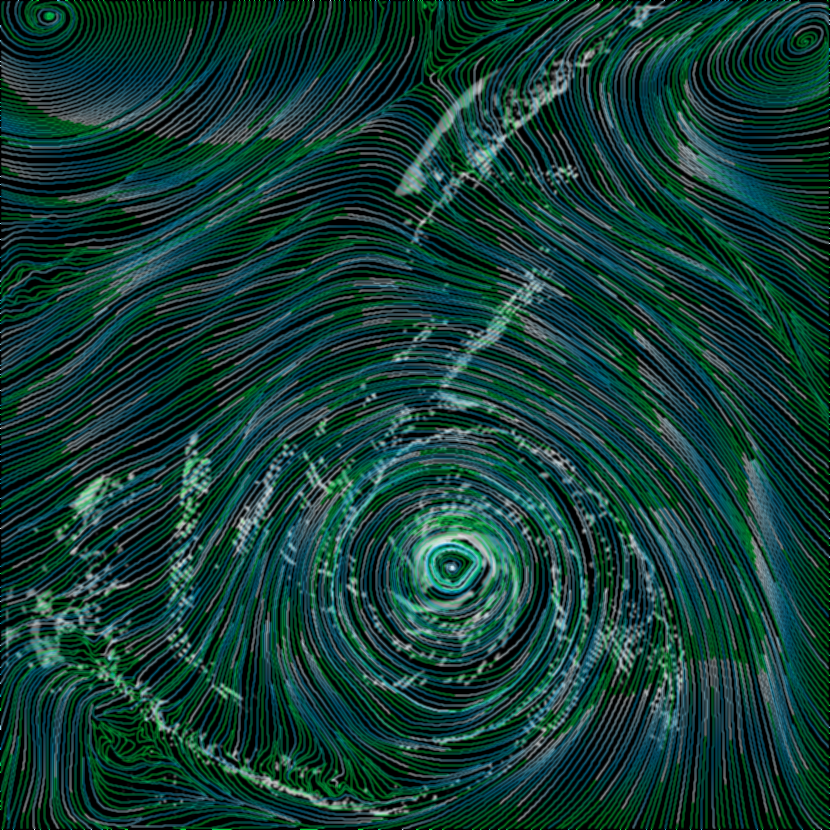
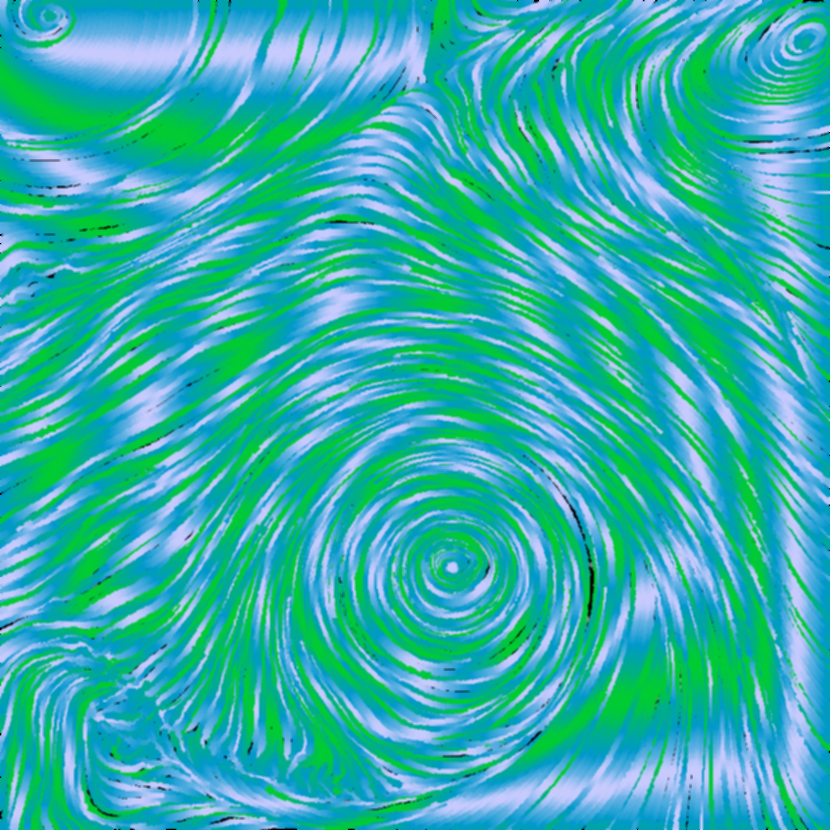
Samples
|
|
|
|

|
|
|
|
|
|
|
|
|
|
|
|

Download
Here you can get the application as a jar file.
Here you can get the javadoc documentation.
To run the application one should write: java -jar FlowVis.jar in the command line.
Datasets can be obtained from the coures website (for educational purposes only).