|
|
Direct Volume Rendering |

Bilal Alsallakh, (00627567)
Jana Banova, (e0326272)
TU Vienna, Winter Semester' 07
Based on:
Marc Levoy, "Display of Surfaces from Volume Data", IEEE Computer Graphics and Applications, Vol. 8(3), pp. 29-37, Feb.1987
Table of Contents
Introduction
The purpose of this work is to implement the raycasting algorithm for volume visualization, and enables user interaction to define the parameters for shading and classification.
Raycasting is a relatively easy approach to perform volume rendering, and the insight provided by the rendered images depends substantially on the transfer function in use. The straightforward implementation of the algorithm is relatively slow, especially for larger volumes and a small sampling step. Although many many functionalities in modern graphics cards have been developed to support the raycasting algorithm, we chose to perform software rendering supporting much wider range of consumer PCs, and ensuring more portabilities.
Two modes have been implemented for each of projection, composition and lighting.
Fig.1 depicts a screen shot of the developed program, which will be explained in the next section.
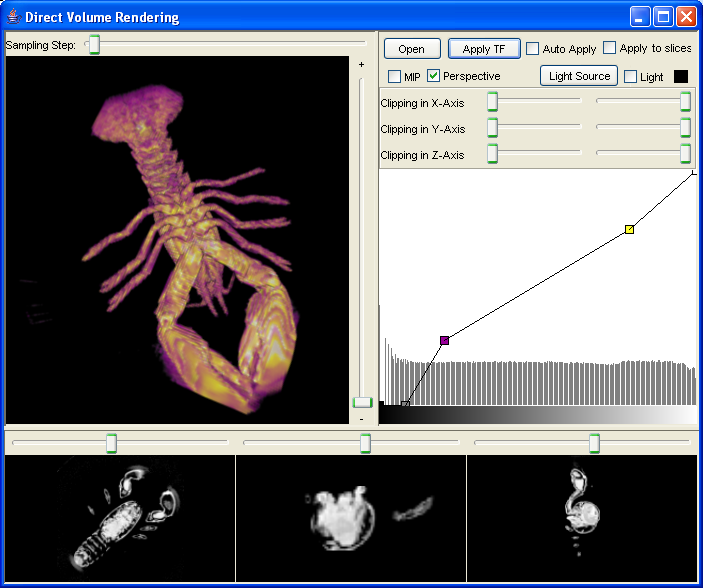
Fig.1. The main screen of the program
User Guide
Hardware Requirements:
-
A color graphic card
-
Free memory of at least twice as large as the size of the volume dataset.
-
A color screen
As can be seen in Fig.1., the main screen is divided into three major areas.
The 3D volume rendering area
It views the volume.
Enables setting the viewing direction with the mouse.
Setting the sampling step (higher values mean faster rendering, but lower resolution)
Setting the zoom factor
The slices viewer
It views the volume slices in z-direction (left), y-direction (middle), and x-direction (right).
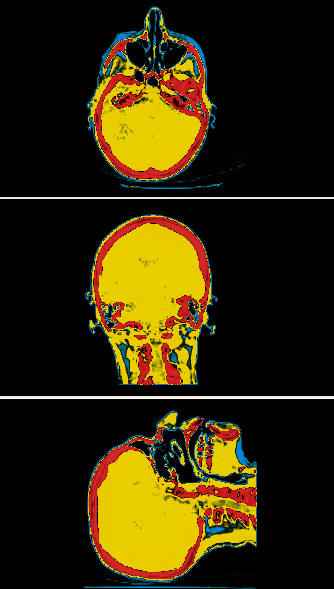
Fig.2: Slices in the axes directions
The Control Panel
various settings can be specified here.
Choosing a data file: it is assumed to be of the format specified in the exercise webpage.
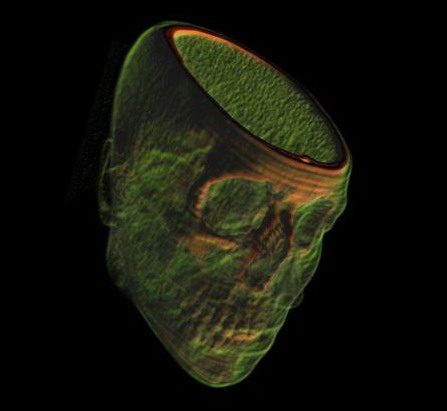
Clipping: a sub-volume can be defined by choosing a range along each axis. This can be useful to examine inner structures
Projection Type: whether it should be perspective or orthogonal. Perspective projection produces more natural images, but introduces an uneven scaling which can slightly distort the image. Orthogonal projection is more
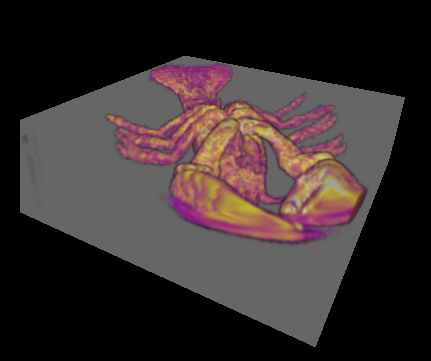
Fig.2. Perspective Projection
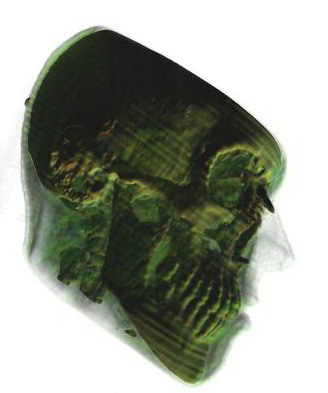
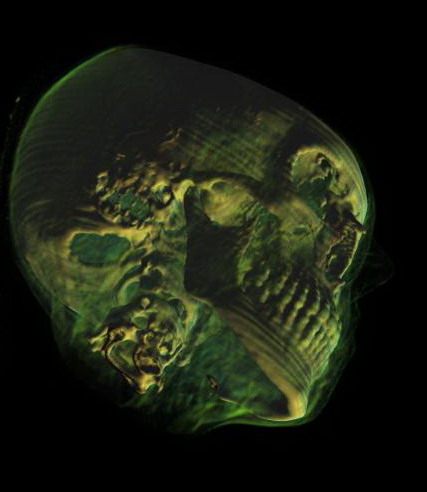
Composoition Type: Whether composition should be performed using the absorbtion and illumination model, or by using the maximum intensity projection (MIP).
MIP chooses the sample with the highest (transferred) density value along the casting ray, giving an X-Ray-like image, with high emphisize on dense areas and their distribution in the volume.
The absorbtion and illumination model produces a more realistic image
|
|
|
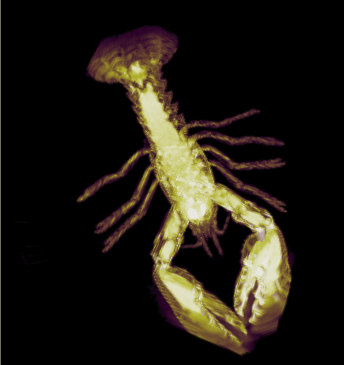
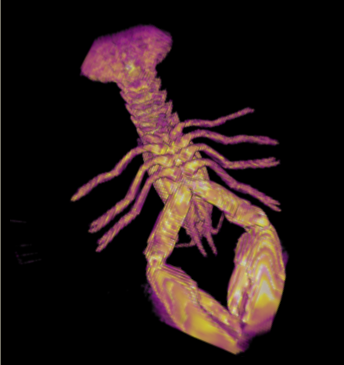
Fig 3. Composition using MIP (left) vs. absorbtion and illumination (right)
Transfer Function: This function associates a color and obacity for every density value.
In the current implementation, the transfer function editor enables adding control points, choosing a color for each point, and moving it to assign the desired obacity value at (vertically axis) at a desired density value (horizontal access).
The color and obacity are linearly interpolated between sucessive control points.
Further, the histogram of the densities is viewed in the background to provide some guidance for defining the function.
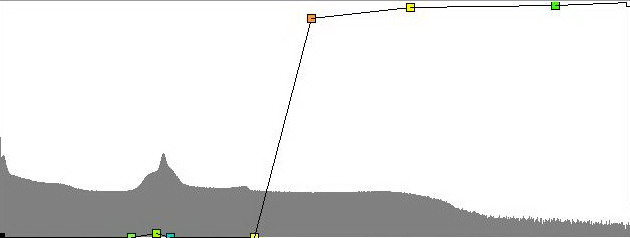
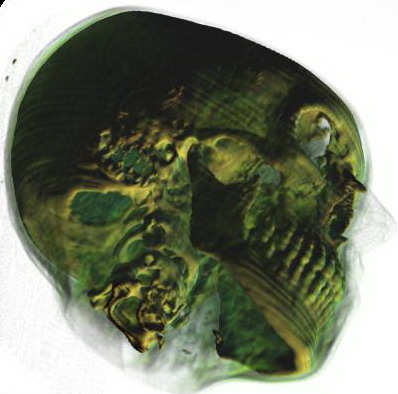
Fig.4. A transfer function and the corresponding image
The transfer function can be applied either immediately after a change, or upon a click on "Apply TF" button. Further, it can be applied to the slice views.
Lighting: after the colors are assigned by the transfer function, they can be modified by a light source. A surface normal is computed at each voxel (based on the values of neighboring voxels), and the color brightness is increased if the this normal points to the light source (according to the Phong shading model). From the control panel, the use can enables the light, as well as defining the location of the light source. Further, the background color can be configured.
Samples
Dataset: CTHead
|
|
|
|
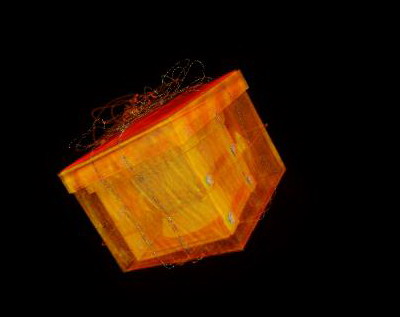
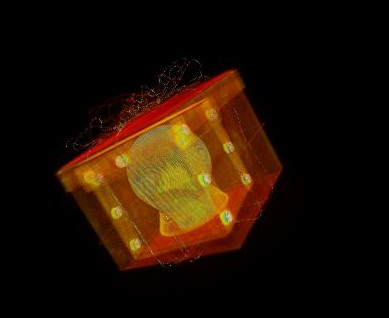
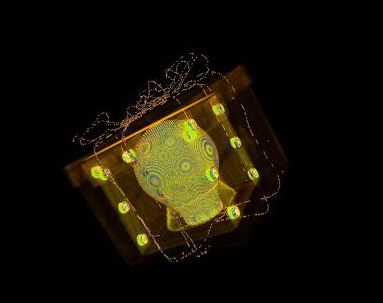
Dataset: Chrismas Gift (das englische Gift)
|
|
|
|
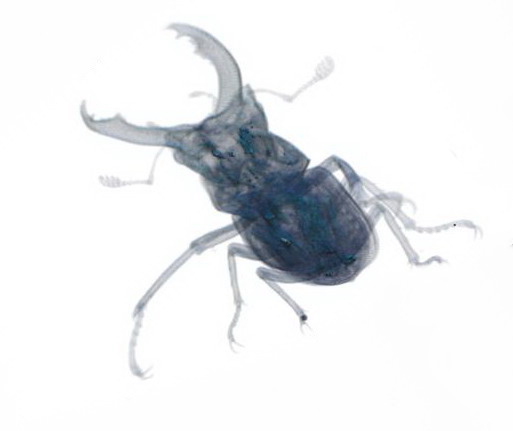
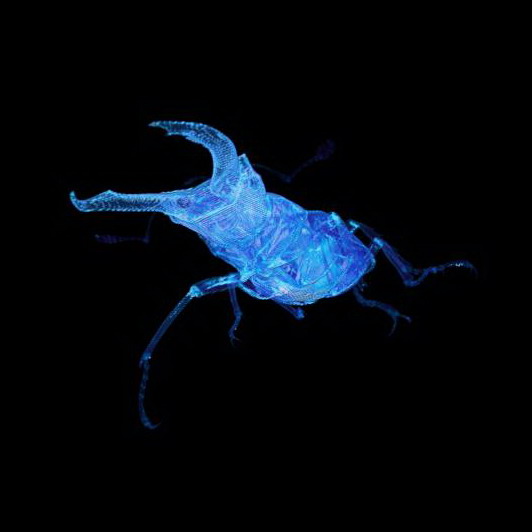
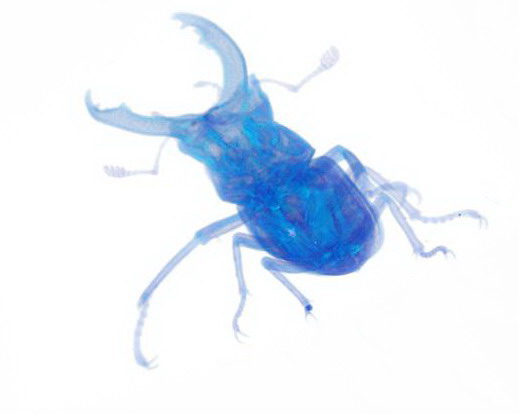
Dataset: Stagbeetle
|
|
|
|
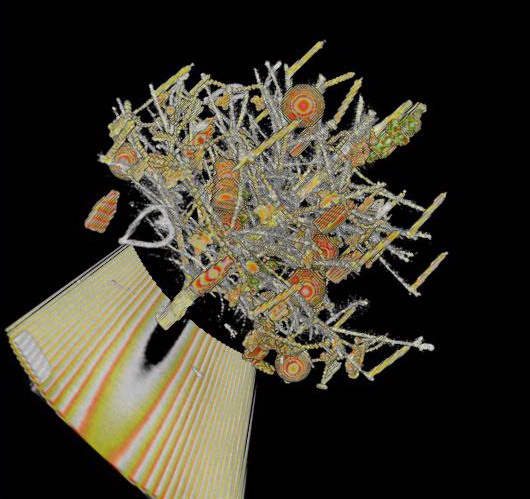
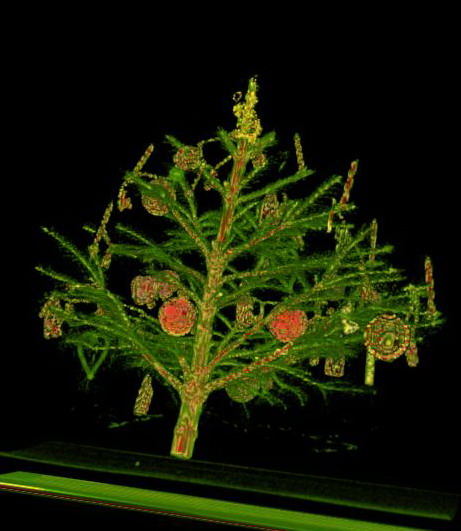
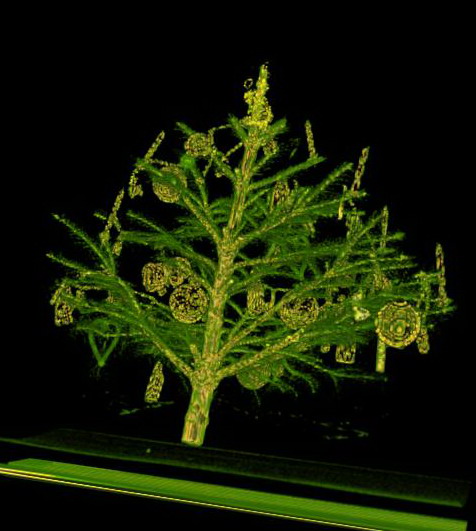
Dataset: Xmas Tree
|
|
|
|
Download
Here you can get the application as a jar file.
To run the application one should write: java -jar VolVis.jar in the command line.
Datasets can be obtained from the coures website (for educational purposes only).