VolVis

VisLU WS 2006/07
subglobal1 link | subglobal1 link | subglobal1 link | subglobal1 link | subglobal1 link | subglobal1 link | subglobal1 link
subglobal2 link | subglobal2 link | subglobal2 link | subglobal2 link | subglobal2 link | subglobal2 link | subglobal2 link
subglobal3 link | subglobal3 link | subglobal3 link | subglobal3 link | subglobal3 link | subglobal3 link | subglobal3 link
subglobal4 link | subglobal4 link | subglobal4 link | subglobal4 link | subglobal4 link | subglobal4 link | subglobal4 link
subglobal5 link | subglobal5 link | subglobal5 link | subglobal5 link | subglobal5 link | subglobal5 link | subglobal5 link
subglobal6 link | subglobal6 link | subglobal6 link | subglobal6 link | subglobal6 link | subglobal6 link | subglobal6 link
subglobal7 link | subglobal7 link | subglobal7 link | subglobal7 link | subglobal7 link | subglobal7 link | subglobal7 link
subglobal8 link | subglobal8 link | subglobal8 link | subglobal8 link | subglobal8 link | subglobal8 link | subglobal8 link

Main Page

VolVis

This program (developed by Markus Klepp and Arnaud Moreau) helps you to render your volume data. It was developed as an exercise for the lab Visualization at the Vienna University of Technology. The rendering algorithm is based on the legendary paper "Display of Surfaces from Volume Data" by Marc Levoy.

features:
. fully editable transferfunction
. 4 rendering modes (MIP, Levoy, first-hit)
. intuitive and non-standard GUI
. rendering in hardware (shaders)

The program is based on OpenGL and GLUT. Rendering was implemented using GLSL shaders.


The GUI

The GUI is inspired by Exposé from Apple Computers (http://www.apple.com/macosx/features/expose/) so you can access the GUI elements by moving the mouse to the corners of the window. We have 4 elements:

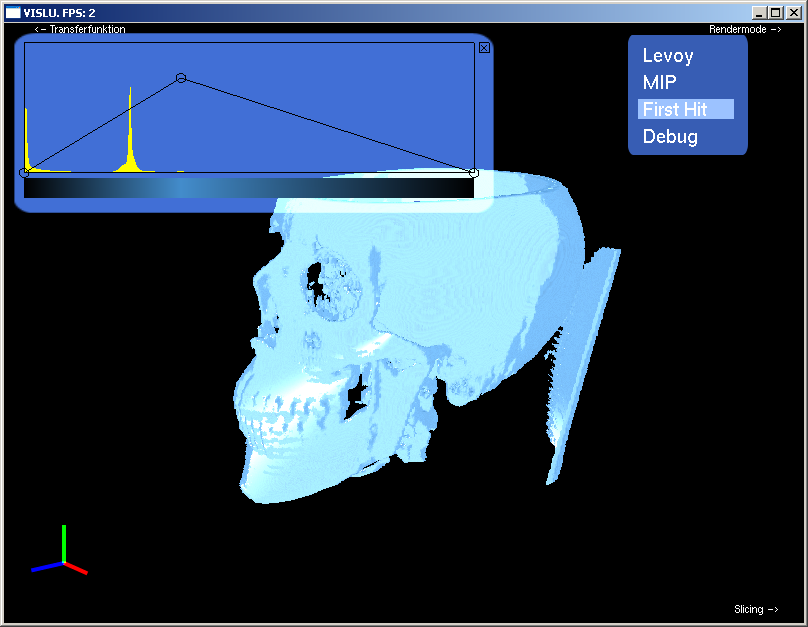
Transferfunction Editor (upper left corner)
Axis Align Element (lower left corner – always visible)
Slicing Element (lower right corner)
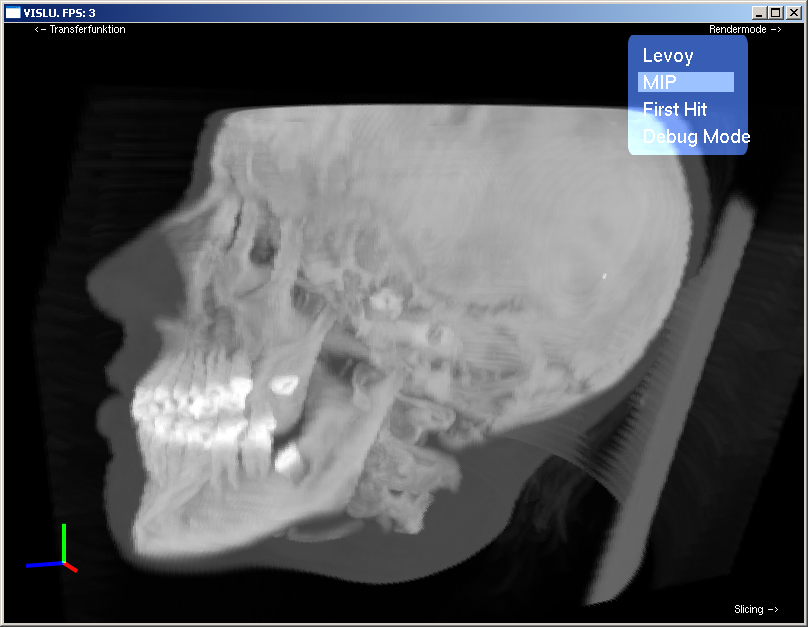
Render Mode Element (upper right corner)

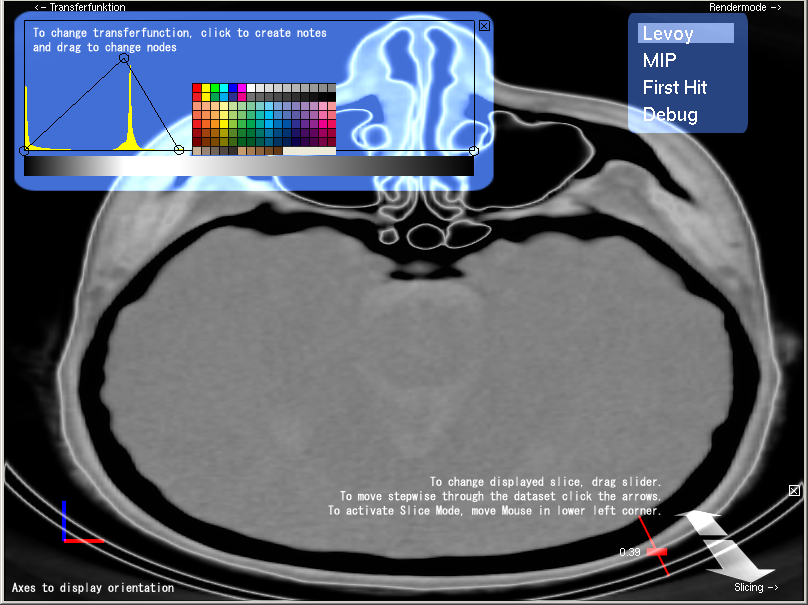
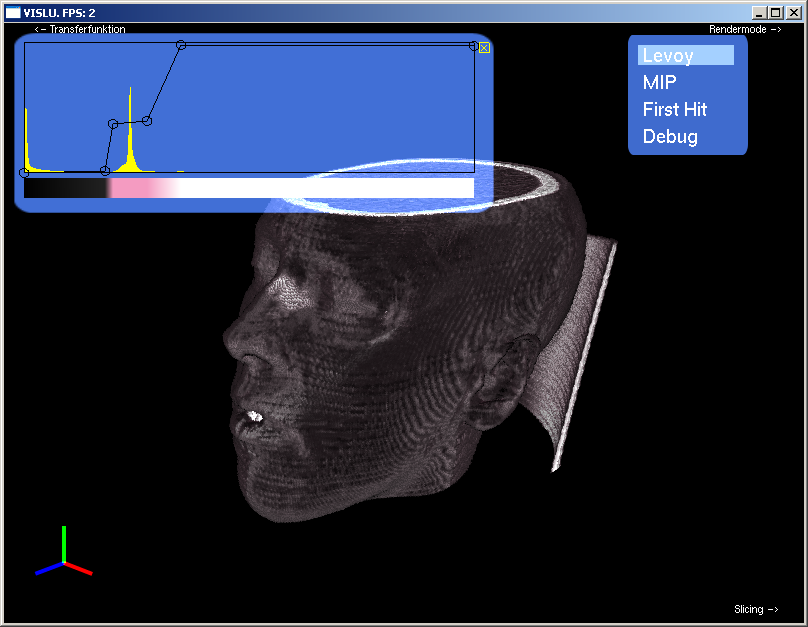
The Transferfunction Editor allows you to edit the transferfunction used to render the volume data. On the background it shows a histogram of the density values in the data which helps you to find peaks and place the function nodes. You can assign a color and an opacity value to each node, by clicking on it. The opacity value is the y position of the node. A new node can be created by clicking anywhere in the Transferfunction space. Of course also dragging existing nodes is allowed.

The Axis Align Element always shows the correct orientation of your volume in the main frame. You can change the orientation by dragging the mouse on the volume. Furthermore it can axis-align your volume by clicking on one of the coordinates.

The Slicing Element is used to change to slicing mode. You can move through the slices by using the slider or clicking the arrow.

The Render Mode Element allows you to change the rendering mode. First Hit Rendering shows the voxel on the entry position of the ray, depending on the chosen density value. MIP (Maximum intensity projection) shows the voxel with the maximum intensity and Levoy Mode performs compositing as proposed in his paper "Display of Surfaces from Volume Data".

When holding the ALT key and dragging the mouse, the camera distance is changed.

Contact Us | ©2006 Moreau/Klepp