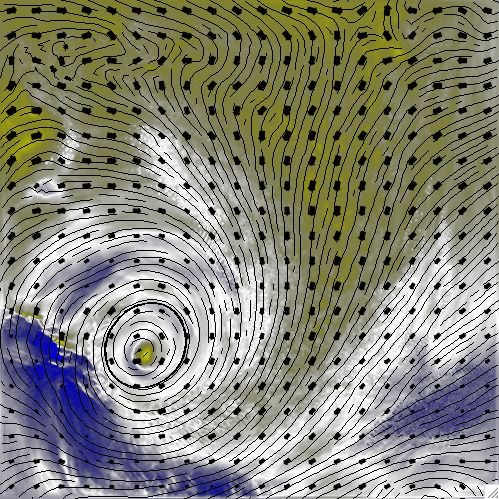

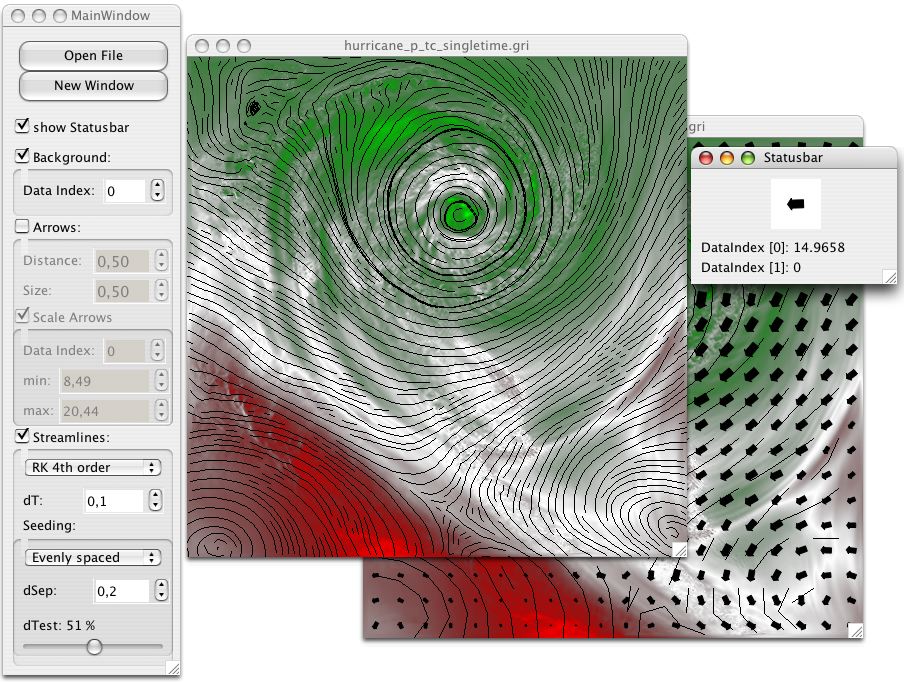
This screenshot shows the main user interface of our application. The
rendered images are shown in separate windows. New windows can be opened at
any time, using the New Window
button. See below for a more
detailed discussion of the features of this user interface. Note that
background, arrows and streamlines can be individually enabled or disabled
to form a complete image.
Open File
opens a new data file for rendering in the current window;
new windows can be opened by clicking new window. show statusbar
opens a new Statusbar
window; see below.
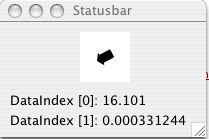
This window tracks mouse movements and shows for each position
the current flow vector as well as the additional data available for that
point (interpolated where necessary). It can be opened by clicking the
show statusbar
checkbox in the main window.

This section allows configuring the rendering of the background. The desired data index to render can be configured. The color is calculated by linear interpolation from red to white in the range (min index, average) and from white to green in the range (average, max index).
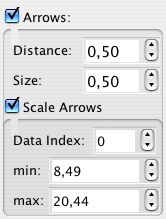
This section allows configuring how arrows are drawn. The size of each arrow and the distance between two arrows can be configured independently. Additionally, arrows can be scaled so that they indicate the value of a data item. The data index to render can be specified as well as the range of the data of interest: Only values in the range [min..max] will show an arrow, with a linear interpolation between the two; values outside the range will not be displayed.
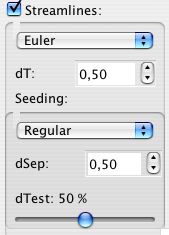
This section configures the streamline renderer. There are three interplation methods available (simple Euler interpolation, and 2nd and 4th order Runge-Kutta interpolation). The highest quality is achieved using 4th order Runge-Kutta, but this also takes the longest time to render.
The dt parameter is an indication of the quality of the rendering. Lower values produce better results at the cost of longer rendering time. This value specifies the distance between two sample points on the stream line.
The placement of the stream lines can also be configured. They can be placed on a regular grid, interactively using mouse clicks, or by finding evenly spaced positions. Regular placement does not give very good results. The dsep parameter is used mainly by the evenly spaced placing algorithm and specifies the distance between two streamlines. dtest specifies when a streamline is aborted when approaching an existing one; it is a percentage of dsep.