Flow Visualization
by jesus 'at' uni-koblenz.de
Basic Features
- arrow plot
- evenly spaced streamlines
-
euler/runge-rutta integration
- scalar values as
backgroundimages
- matlab code provided
- interactive streamline generateion
Documentation
You cannot load an arbitrary data set. Its fixed to the block data. On the left you can select die background to be displayed (presure/vorticity). There are also two checkboxes toggling arrow plot / stream line display. Youn can choose integration method for stream line generation together with the dsep parameter. You first have to push the generate button in order to display the stream lines. Toggling interactive, you can click on the image and streamlines are added with die approprate method and dsep
Download
Matlab source including needed data, also compiled exe (kontaktiere die Übungsleitung)
(matlab crt or matlab needed)
Screenshots
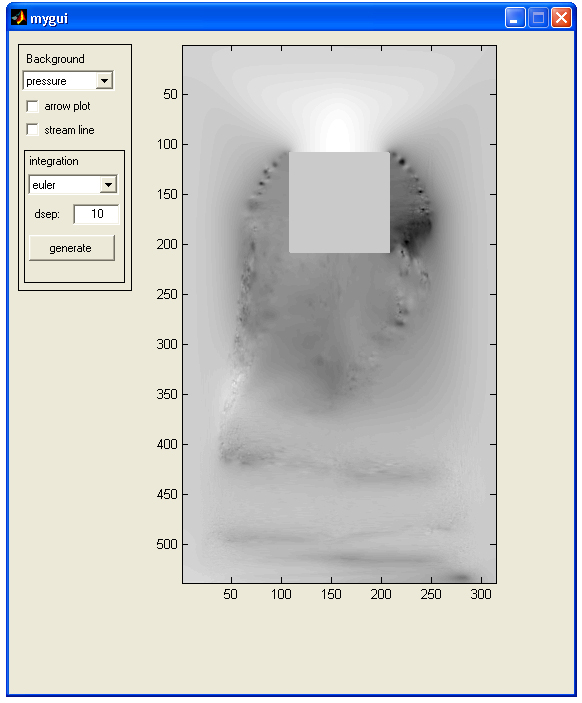
Background
set to pressure
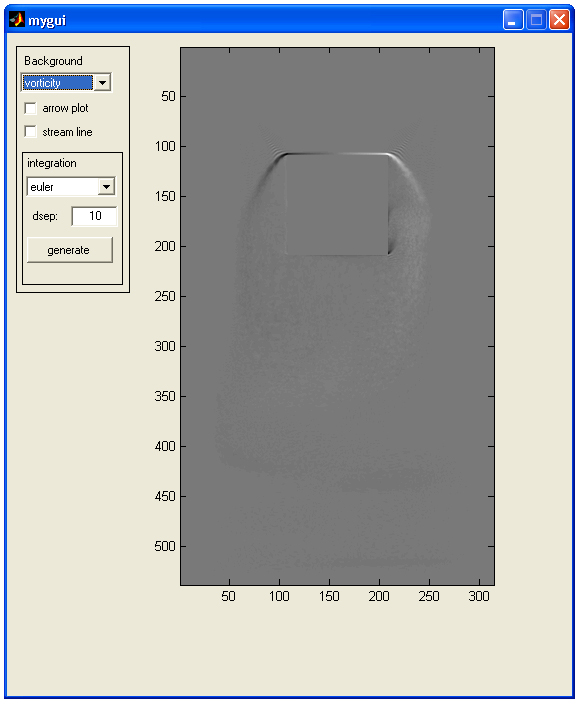
Background
set to vorticity
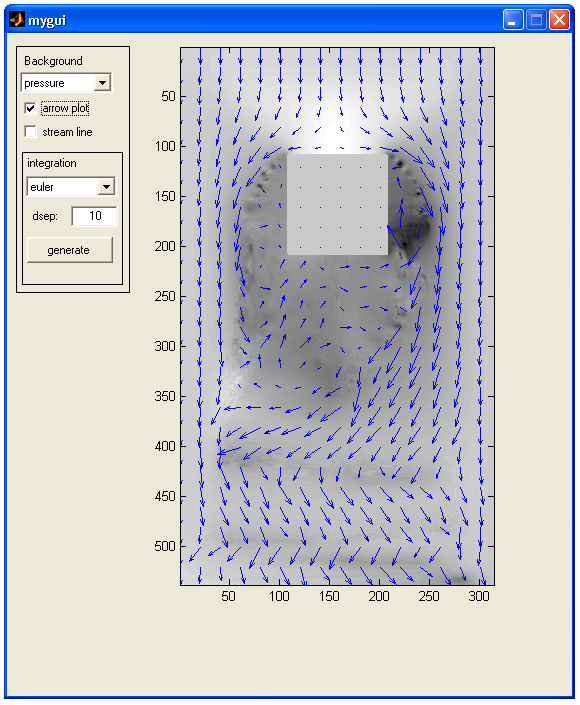
Arrow
plot
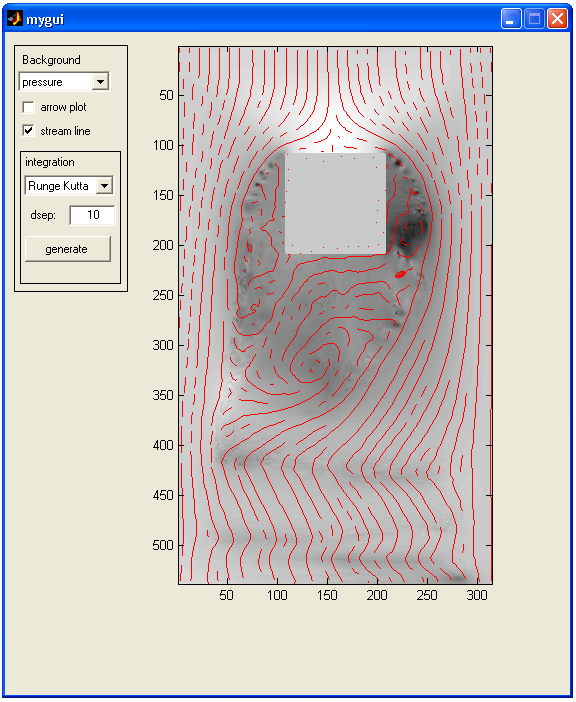
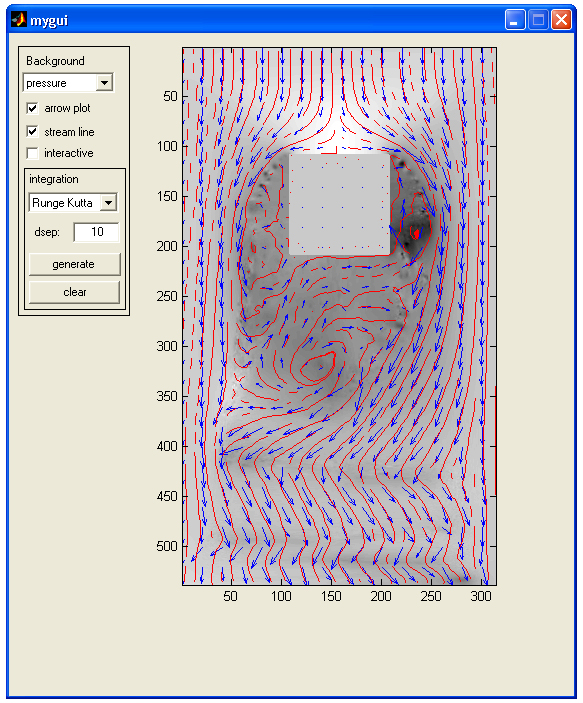
Runge-Kutta
integration; dsep=10 pixel

Euler
integration, dsep = 10 pixel
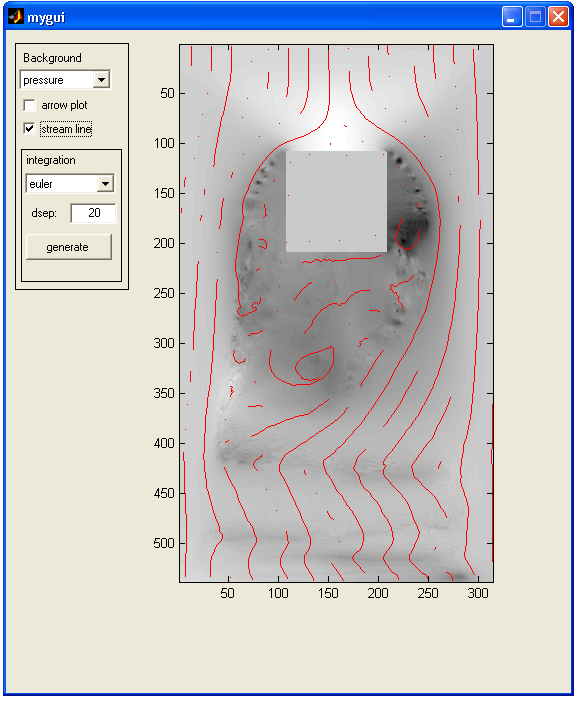
Euler
integration; dsep = 20 pixel
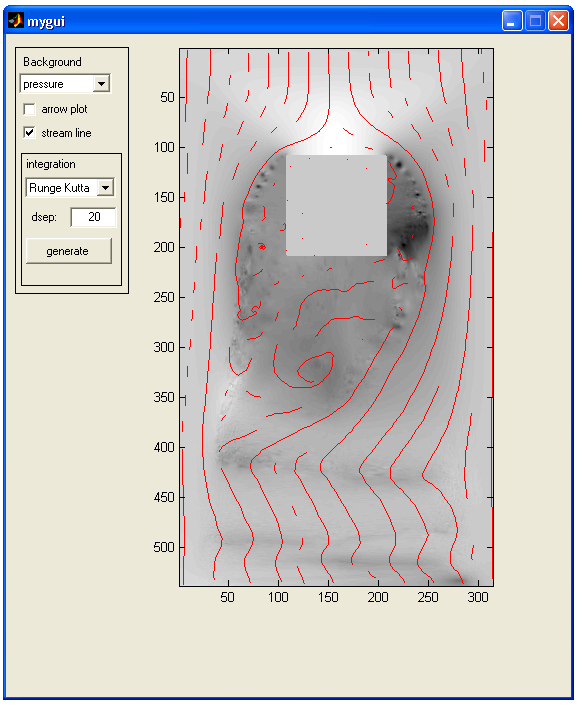
Runge-Kutta
integration; dsep = 20 pixel