~ FLOWVIZ ~
A Flow Visualization programm by Thomas
Lidy
This is what you are able to do with this programm:
Unpack all files into a directory of your choice. You will need Windows as your operating system.
Start the programm with the file FlowViz.exe.
You will additionally need data files in order to be able to
visualize a flow field :-)
The standard data files (which were used
while writing the application) are
- c_block.gri (the grid file)
- c_block.00000.dat (the flow data file)
which are supposed to be in the sub-directory /data.
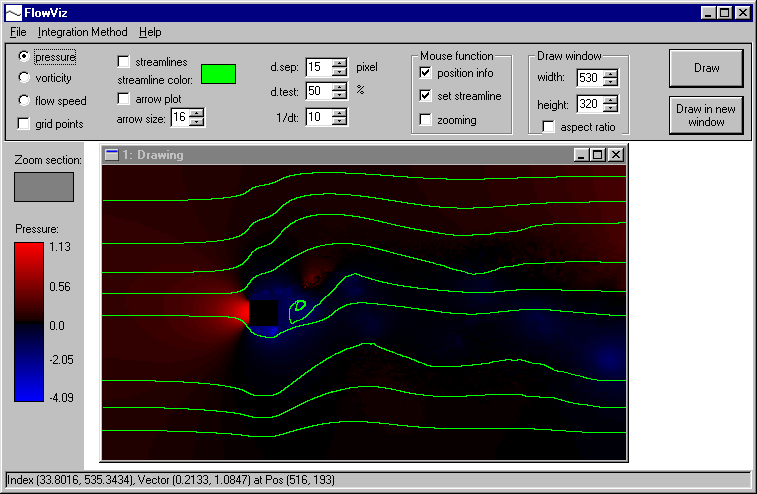
This is a Screenshot of the FlowViz application:
(The parameters of the application are described below.)

The screen is mainly divided into 4 sections:
- the option bar on the top
- the information bar on the left
- the status bar on the bottom
- and the main area, where you can create several visualization
windows.
After selecting the options click 'Draw in new window' on the option bar to create a new window, on which your options will be applied. If you just click 'Draw' the current window will be repainted with the current options.
Detailled description of the options you can choose:
Zooming:
If zooming is selected in the Mouse options, you can arbitrarily zoom into the flow field. That means, you can enlarge details which you are interested in.
To zoom in
... press the left mouse button at the start
position of your desired zoom region (and hold down the button)
... move the mouse cursor to the end position of the zoom region
(indicating a rectangle)
... and release the left button.
The window will immediately redraw - with the parameters which
you've selected first - showing the selected zoom region.
The information bar on the left will show you the selected zoom
section in small as an orientiation. (not yet implemented)
To zoom out
... just press the right mouse button anywhere
in the drawing window.
The window will redraw in the original size, showing the whole flow field.
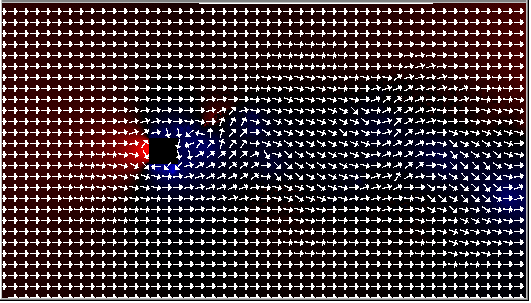
Arrow Plot (arrow size 10), background: pressure (red: positive,
blue: negative)
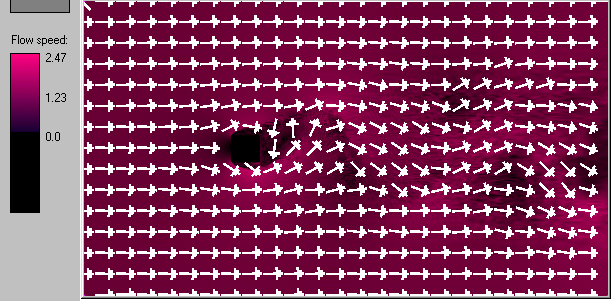
Arrow Plot (arrow size 20), background: flow speed
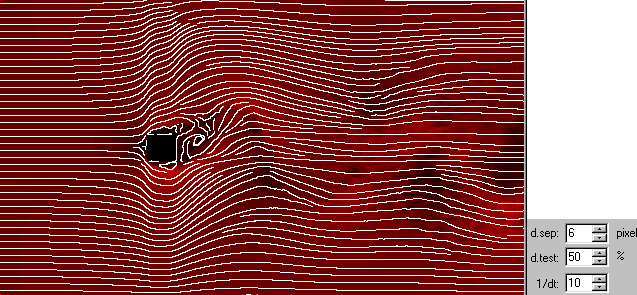
Flow field with streamlines. d.sep = 6, d.test = 50 %;
background: flow speed
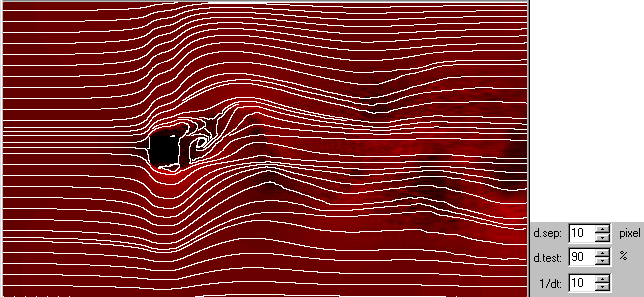
Flow field with streamlines. d.sep = 10, d.test = 90 %;
background: flow speed
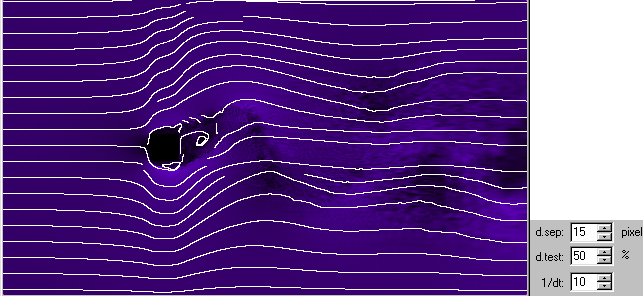
Flow field with streamlines. d.sep = 15, d.test = 50 %;
background: flow speed (other color)
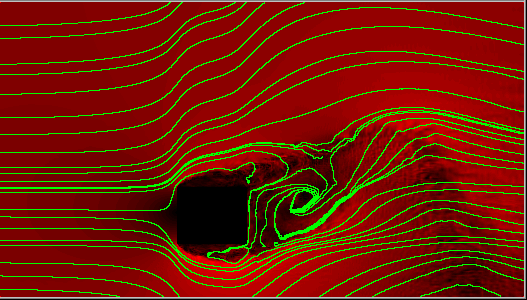
Flow field with green streamlines - zoomed. (background: flow
speed)
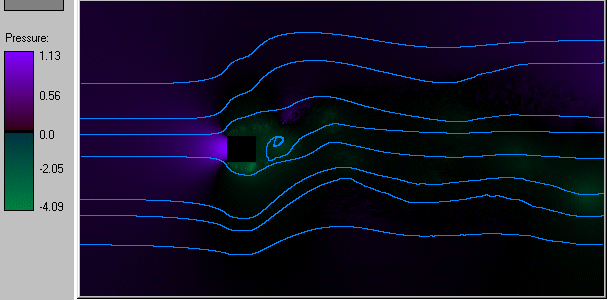
Visualizing pressure (color coding shown at legend) + some user
placed streamlines.
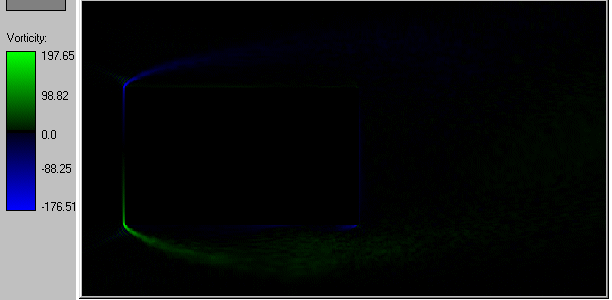
Visualizing vorticity with a strong zoom around to block.
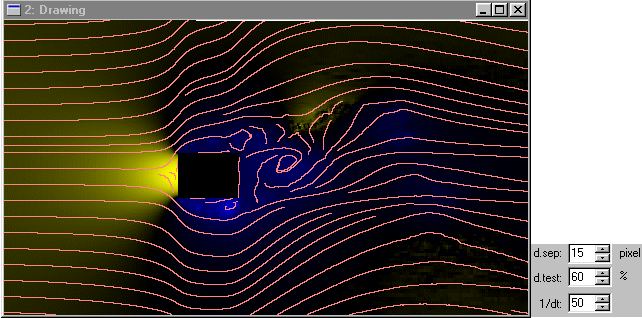
Flow field with streamlines - slightly zoomed. d.sep = 15, d.test
= 60 %; background: pressure
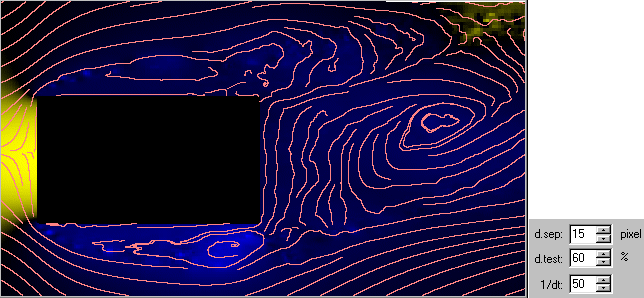
Same as above - stronger zooming shows much more details.
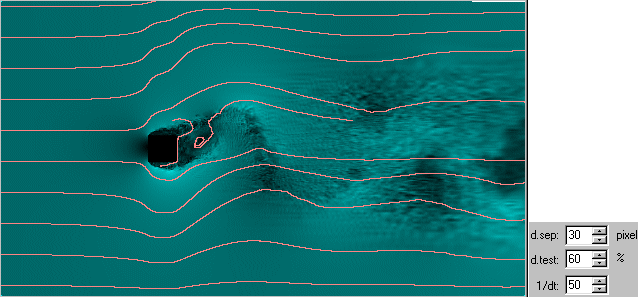
Flow field with streamlines. Integration method: Euler.
d.sep = 30, d.test = 60 %, dt = 0.02; background: flow speed
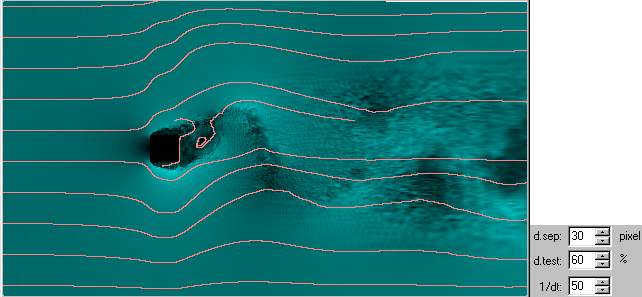
Same as above. Integration method: Runge-Kutta-2.
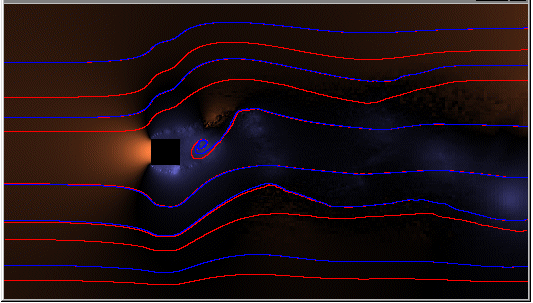
User placed streamlines - Euler vs.
Runge-Kutta-2; dt = 1/10. (background: pressure)
The red streamlines were placed with Euler, some blue streamlines
were placed with RK2 on top of the red ones.
There are some drawing problems with the child windows.
To avoid most of them, the child windows are created at a fixed
position in the white area.
Unfortunatly, when creating multiple child windows, additional
windows will be created behind the 1st
window!
So you will have to move away the 1st window - but be careful:
Moving the window over one of the 3 bars will introduce new
trouble ...
Also, with some (?!) window sizes, there is a debug error message (or crash) when closing the child window. Better keep the default window width & height.
File names currently hardcoded. No File Dialog!
User set streamlines are not redrawn when window is moved
or repainted (i.e. they are lost).
(c) 01/2002 by Thomas
Lidy
Vienna University of Technology