 |
A Program for Visualizing Flow Data by Michael Knapp Visualisierung LU, WS 2000/2001 |
|
A Program for Visualizing Flow Data by Michael Knapp Visualisierung LU, WS 2000/2001 |
| What is it ? | This Program is designed for viewing computer 2D flow data interactively. The flow data is displayed using various flow visualization techniques. |
| Features | Two Layers of Flow
Visualisation Color Coded Flow: Speed, Direction, Additional Data Line Integral Convolution Evenly Spaced Streamlines and Arrows Manually Set Stream Lines Line Integration: Euler, Runge-Kutta |
| Requirements | Microsoft Windows 95/98/NT/2000/XP with OpenGL |
Download |
Download
FloVis 1.0 with MSVC++ 6.0 Source Code (kontaktiere die Übungsleitung) ZIP file, 250KB |
| Screenshot | 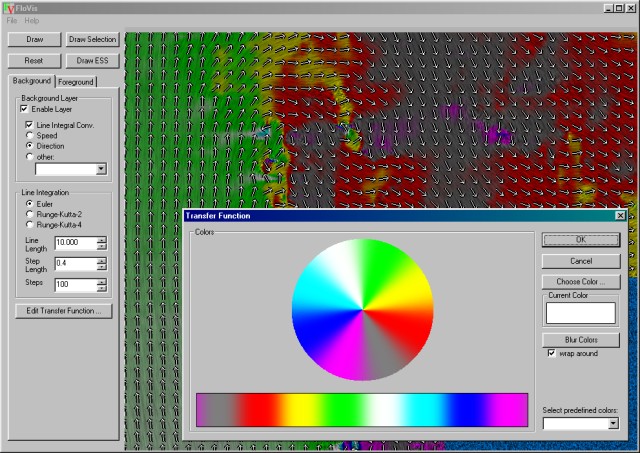 |
Rendering Examples |
(1) Speed - (2) Direction - (3) Direction + LIC - (4)
Direction + LIC + Arrows - (5) Pressure + Stream Lines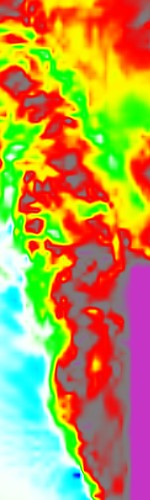 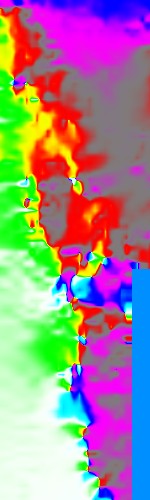 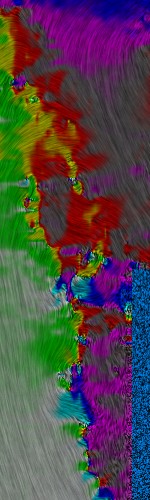 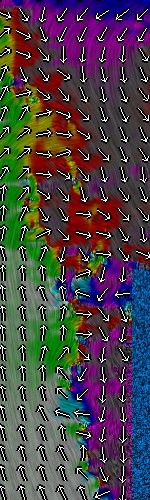 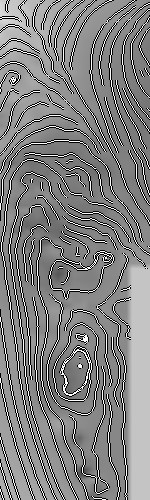 |
User's
Guide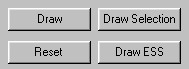 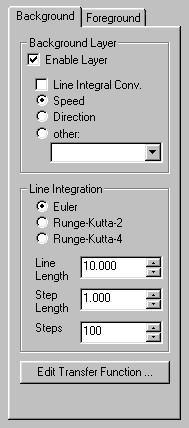 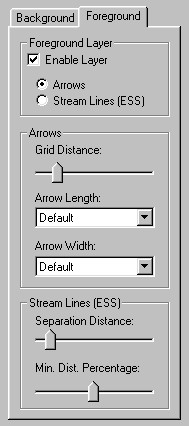 |
Buttons
Background Parameters
The Line Integration Box: The settings for line integration are used in LIC.
Edit Transfer Function opens the Transfer Function Window Foreground Parameters
The Arrows Box: Settings for arrow drawing
The Stream Lines (ESS) Box: Settings for equaly spaced stream lines. Press Draw ESS to redraw the using the current settings
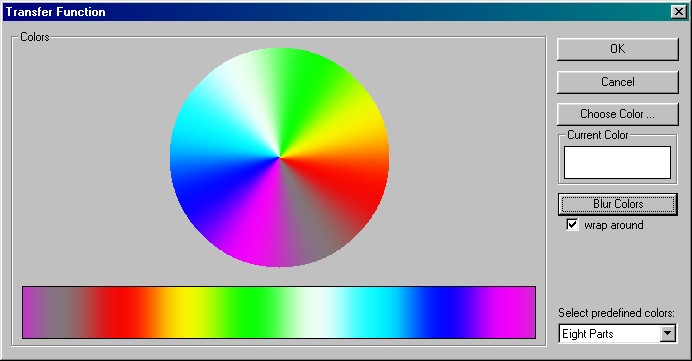
Transfer Function Window
Click into the color bar below the color wheel to apply the Current Color on the transfer function. Click on Choose Color to select the Current Color. Click on Blur Colors to blur the colors to get smooth color shades. If wrap around is checked, the bluring wraps around at the ends of the color bar. That's good for creating a color table for visualizing directional data. A predfined color table can be selected by clicking on one element in the Select predefined colors list. |