This project reproduces the methodology of Yao et al. on the NYC Yellow Taxi dataset using H3 hexagonal spatial aggregation and interactive D3.js visualizations. The aim is to reveal spatial interaction characteristics by encoding movement magnitude and travel distance into direction-based hexagonal glyphs.
file://) may prevent JSON files from loading
due to browser security restrictions.
We discretize NYC into H3 hexagons (resolution 8) and aggregate trips per hexagon. For each hexagon, movements from pickup to dropoff are binned into six directions and summarized with magnitude and distance statistics. The resulting directional summaries are rendered as a direction-based pattern glyph.
The live demo is provided as a single-file launcher with multiple tabs (views): a main interactive view, a paper-faithful reproduction (FIX4), and an overview flow map.
Key views of the interactive system.
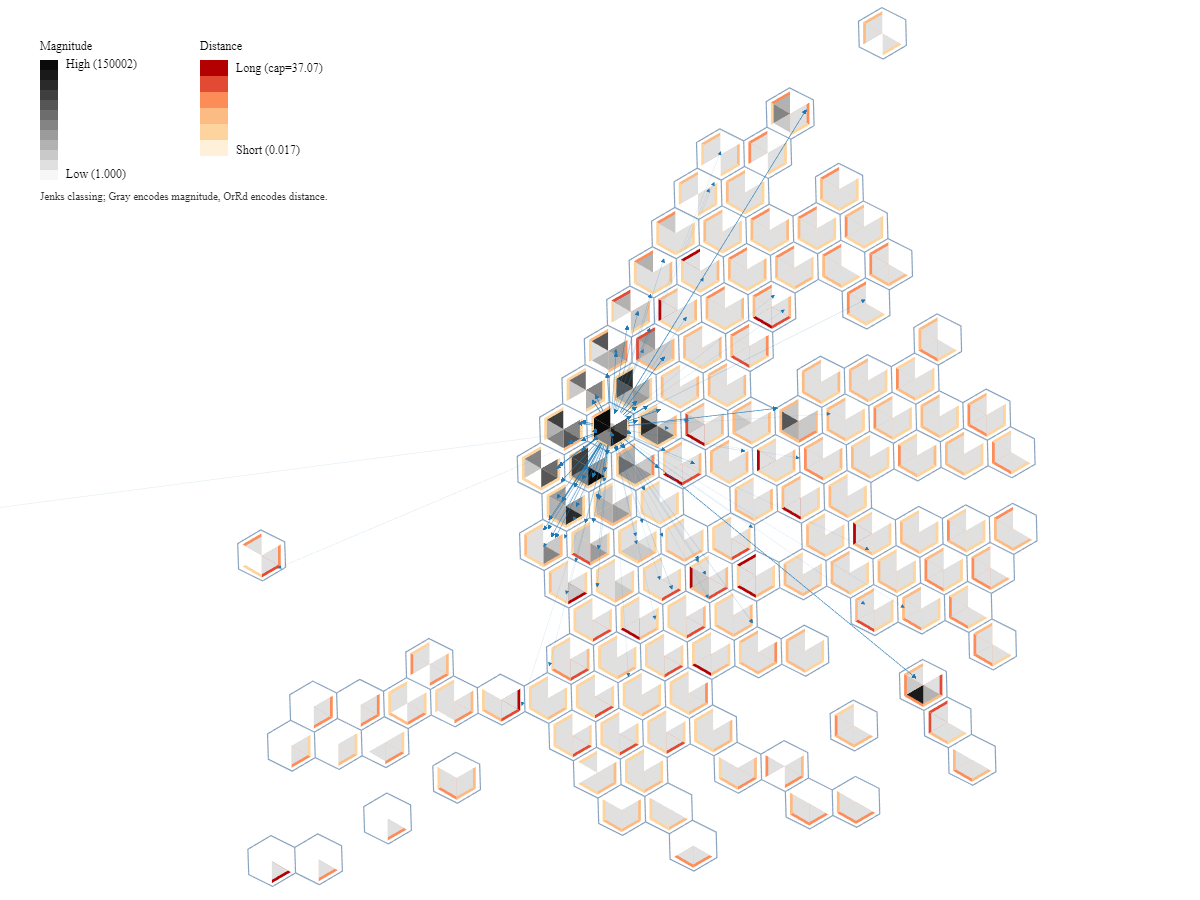
Paper-faithful direction-based pattern map (FIX4 view).
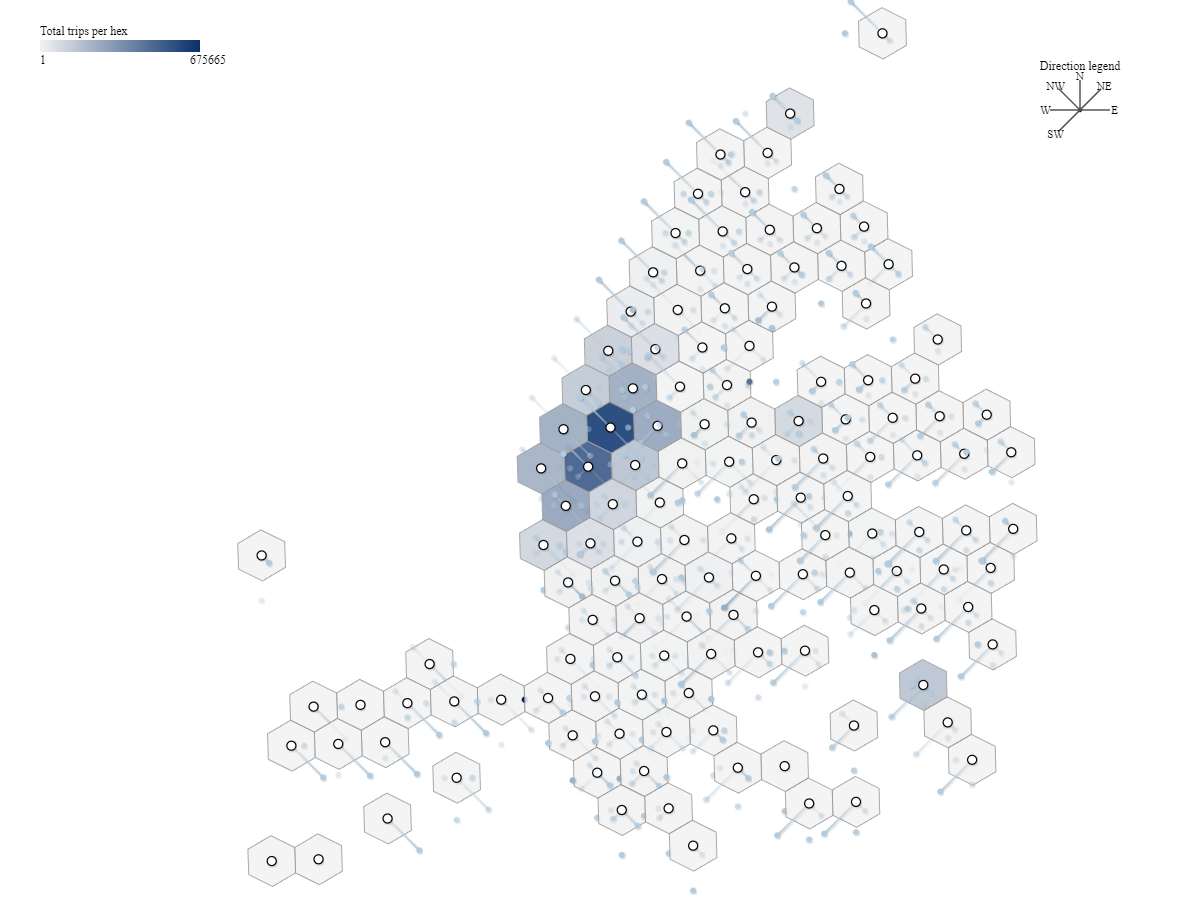
Main interactive direction pattern map with filtering and story modes.
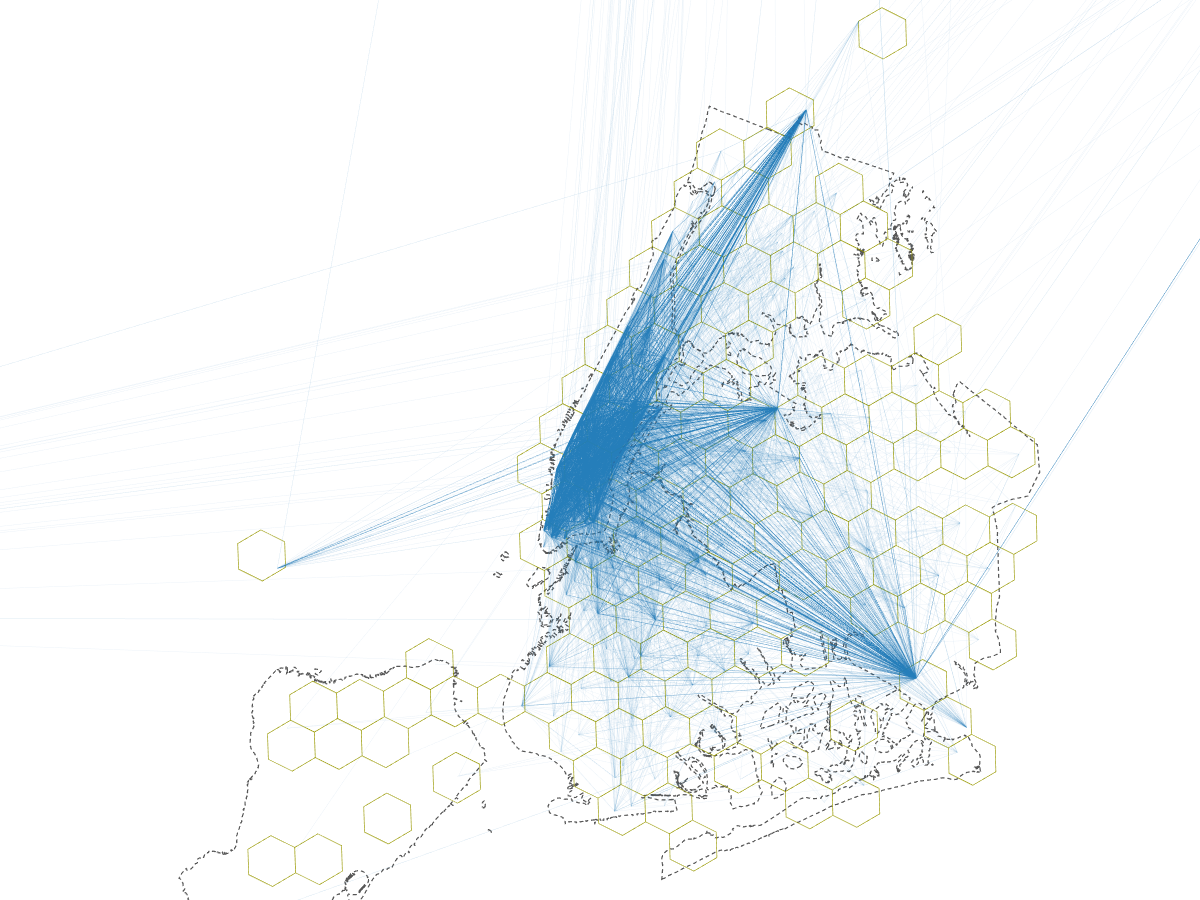
Overview flow map showing a 1% OD sample and spatial context.
site/assets/ match screen1.png, screen2.png, screen3.png.
The preprocessing pipeline produces the following files loaded by the browser:
Start a local web server from the project root folder (C:\Users\Mehran\viz), then open the project website:
cd C:\Users\Mehran\viz py -m http.server 8001
http://localhost:8001/site/
py if python is not recognized.