Project Goal
The goal of this project was to implement the FeatureLego framework (Jadhav et al., 2019) using modern WebGPU and D3.js FeatureLego is a volume exploration approach that partitions a volumetric dataset into semantic regions ("Legos") that users can interactively select and group. This implementation leverages WebGPU for high-performance volume rendering and clustering, and D3.js for the interactive meta-cluster tree visualization.
Demo Video
Visualization & Algorithms
The core idea is to allow users to select "features" directly. The pipeline consists of four major stages, all implemented in JavaScript and WGSL:
1. Super-Voxel Generation (SLIC 3D)
The volume is over-segmented into compact, perceptually homogeneous super-voxels using SLIC (Simple Linear Iterative Clustering) adapted for 3D. This reduces the complexity of the dataset from millions of voxels to a few thousand super-voxels (graph nodes).
2. Exhaustive FH Clustering (Approximation)
We use the Felzenszwalb-Huttenlocher (FH) graph-based clustering algorithm. Instead of guessing a single parameter k, the system runs an "exhaustive" parameter scan (sampling logarithmic steps of k). Stable regions that persist across multiple scales are identified and stored as candidate features.
3. Meta-Cluster Tree Construction
To organize the hundreds of overlapping regions generated by the exhaustive step, we build a Meta-Cluster Tree.
- Similarity Graph: Regions are connected based on Jaccard distance (overlap).
- Hierarchy: A Minimum Spanning Tree (MST) is built using a Reverse-Delete strategy to group highly similar regions into "Meta-Clusters".
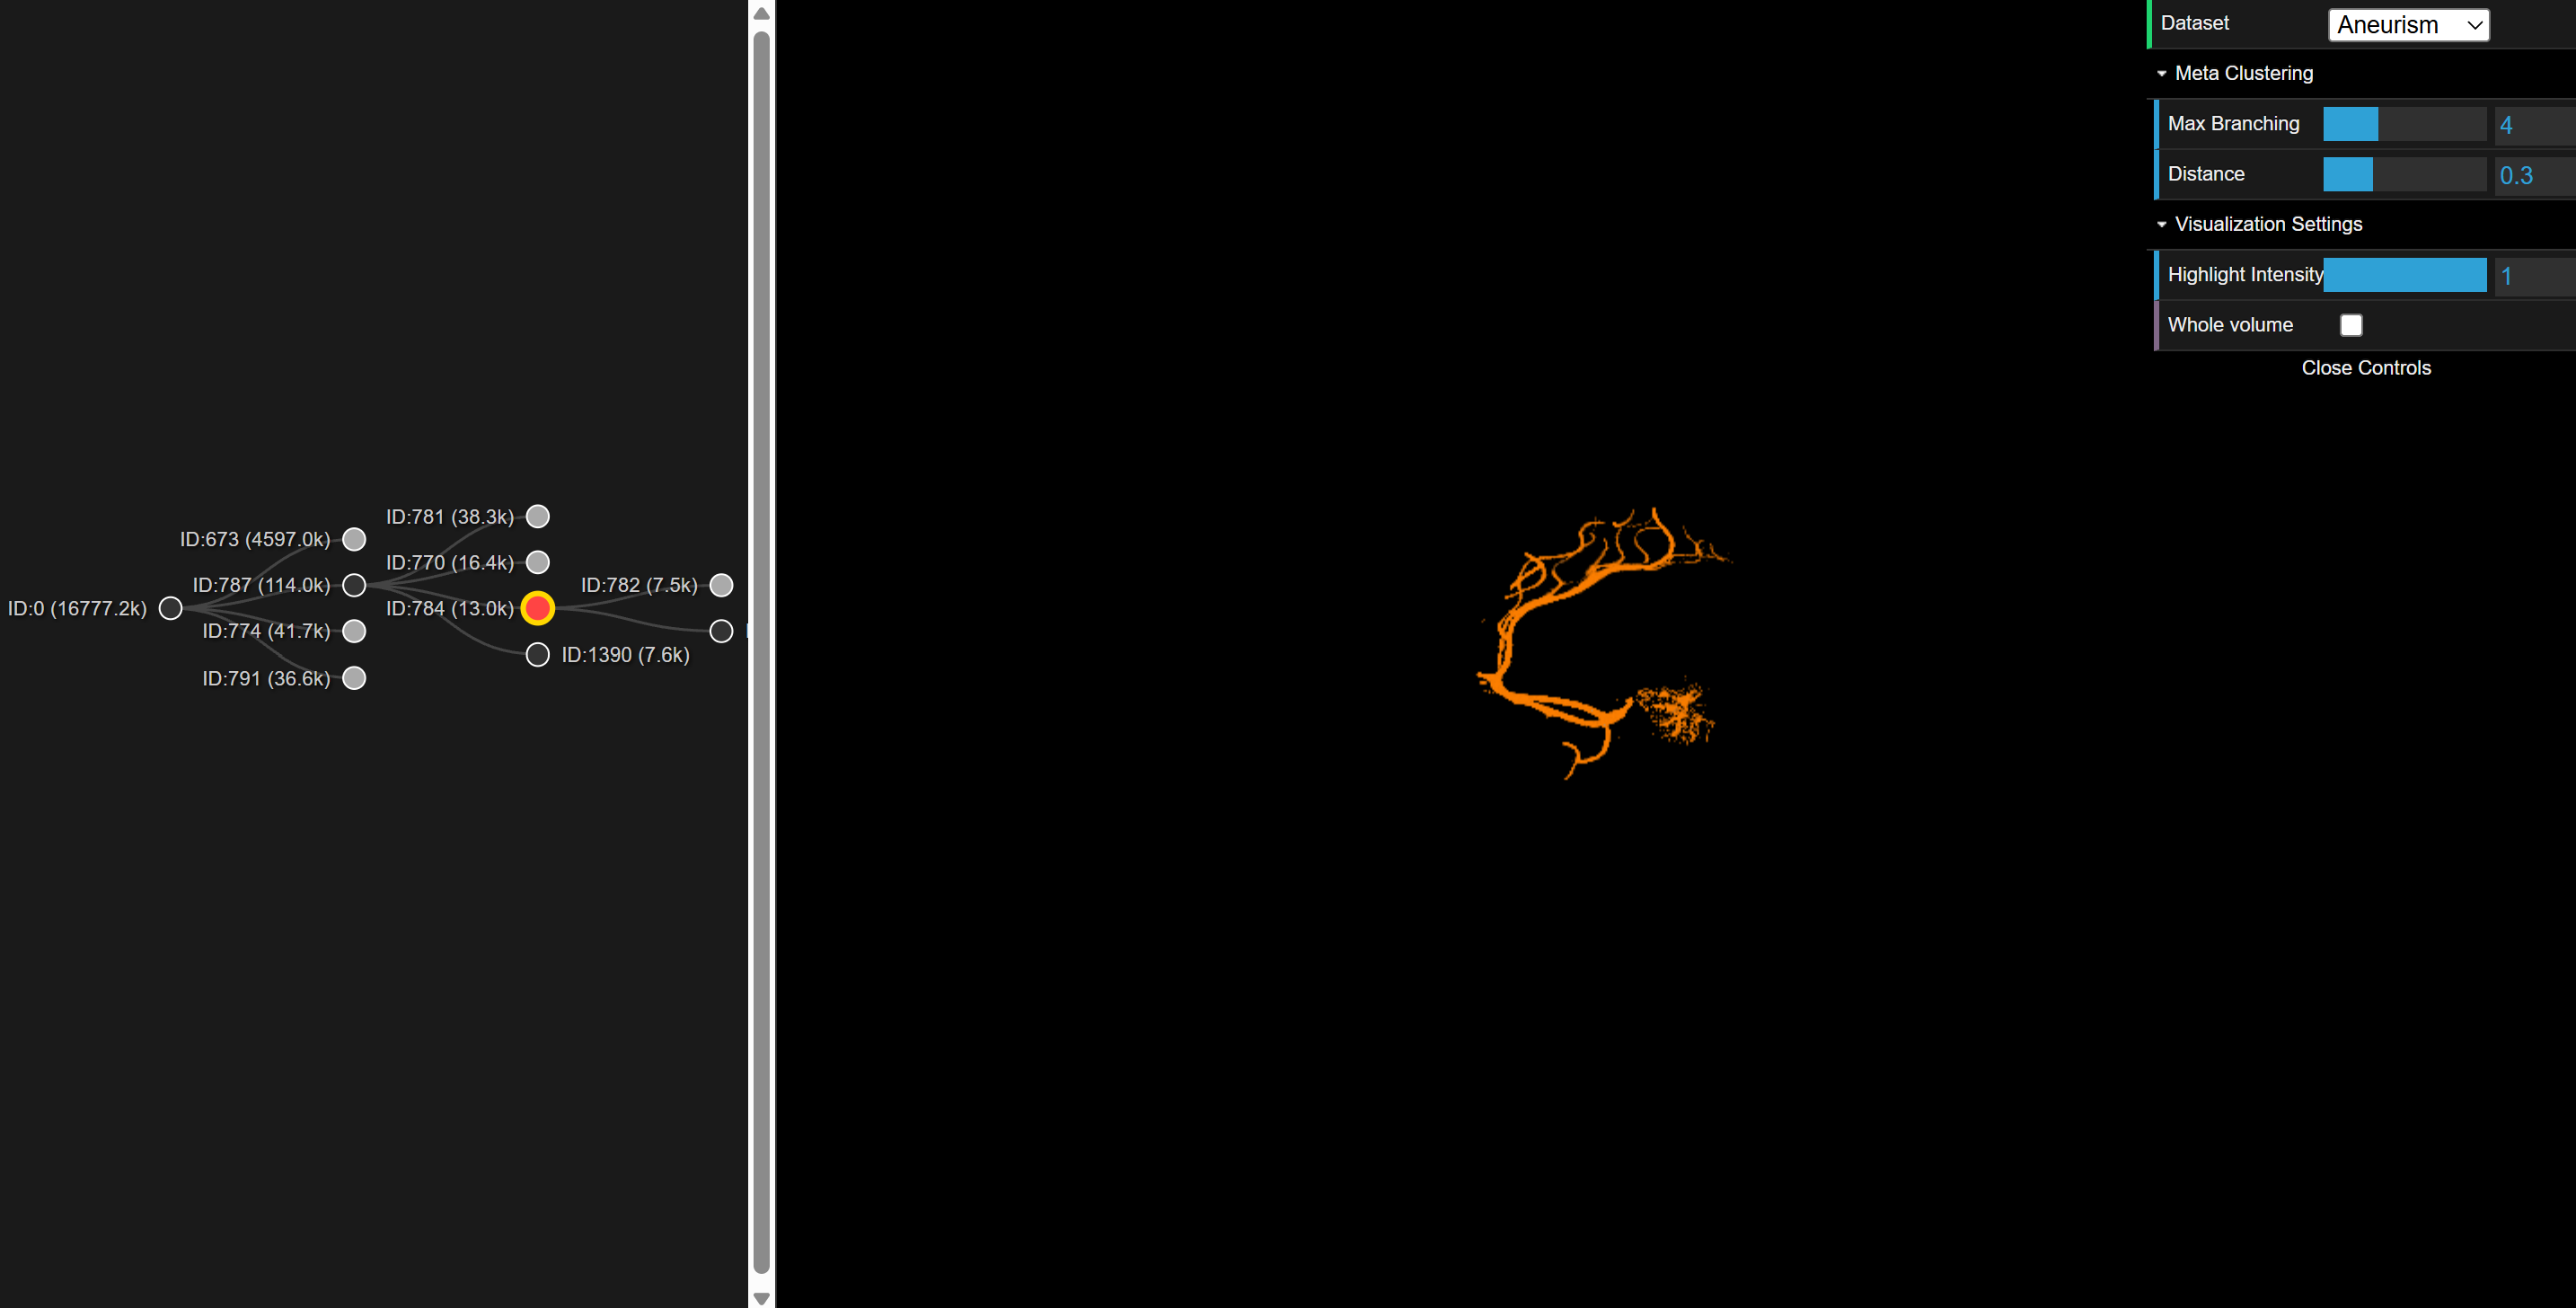
4. Linked Views
The system features two linked views:
- 3D View (WebGPU): A ray-marcher rendering the volume. Selected regions are highlighted using a dynamically generated mask texture.
- Tree View (D3.js): A collapsible tree diagram representing the meta-cluster hierarchy. Clicking a node highlights the corresponding aggregate region in 3D.
Usage Guide
The application runs directly in a WebGPU-compatible browser (Chrome/Edge/Firefox Nightly).
Interaction
| Action | Result |
|---|---|
| Left Mouse Drag | Rotate the volume in 3D space. |
| Click (Tree Node) | Select a region/meta-cluster. The 3D view updates to highlight this region. |
| Key '1' | Toggle/Cycle highlight intensity (mix factor between original volume and region mask). |
| Spacebar | Toggle "Show Only Highlight" (renders non-selected voxels as transparent). |
Parameters (GUI)
A dat.GUI panel allows real-time adjustment of the clustering pipeline:
- Dataset: Switch between loaded .vol files (Aneurism, Fuel, etc.).
- Max Branching: Controls the breadth of the meta-cluster tree.
- Highlight Intensity: Adjusts the intensity of the highlight effect.
- Show Only Highlight: Toggle to render only the selected region.
- Zoom: Adjust the zoom level of the 3D volume rendering.
Datasets
The project supports standard 8-bit raw volumetric datasets. The following datasets from the TC18 3D Images Repository are supported:
- Aneurism (256³): x-ray scan of the arteries of the right half of a human head.
- Fuel (64³): Simulated fuel data.
- Shockwave (64x64x512): Medical CT scan of a human head.
- Neghip (64³): Simulation of the spatial probability distribution of the electrons in a high potential protein molecule.
- Nucleon (41³): Simulated particle data.
- Silicium (98x34x34): Simulation of a silicium grid.
- Skull (256³): Medical x-ray of a human skull.
References
- FeatureLego Paper: S. Jadhav, S. Nadeem and A. Kaufman (2019). FeatureLego: Volume Exploration Using Exhaustive Clustering of Super-Voxels. in IEEE Transactions on Visualization & Computer Graphics, vol. 25, no. 09, pp. 2725-2737, Sept. 2019, doi: 10.1109/TVCG.2018.2856744.
- Datasets: TC18 3D Images Repository