To run our project on a web server:
1. go to src/bin
2. install node.js
3. run "npm init -y" in terminal in the bin folder
4. run "npm install express"
5. run "npm install d3"
6. to run the app use: "node server.js"
7. open "http://localhost:3000/" in your browser
The alternative is to run the application on the Stackblitz server under link.
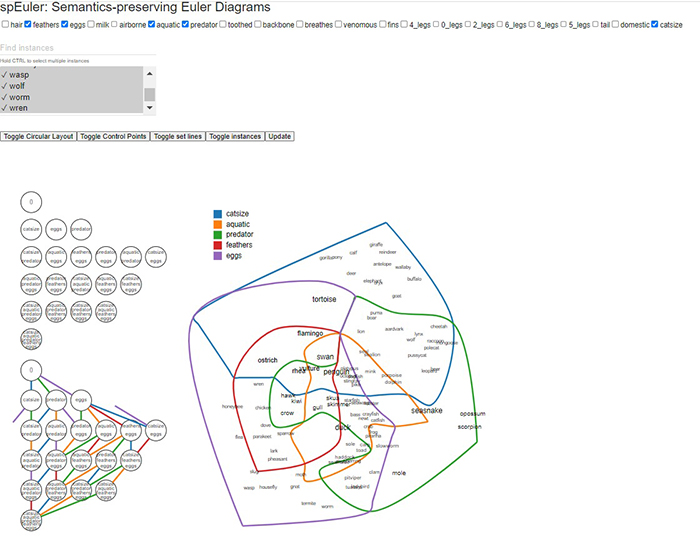
In the proposed paper, the authors present the method to visualize highly overlapping datasets with semantics-preserving Euler diagrams. The main goal is to achieve well-matchedness and well-formedness of diagrams. A graph is well-matched, if each intersection is placed once and there are no empty sections in the graph. Well-formedness of a graph is given, if there is no point where more than two sets intersect. They propose the two-step approach which always leads to well-matched graphs, and violates the well-formedness, as little as possible. For this approach, all intersections in the data set are calculated. From the calculated intersection a rank-based euler graph is produced. This graph is reshaped into a circular layout. From the circular graph a planar euler diagram is formed by drawing curves. We additionally added text of the attributes automatically.
The documentation of our implementation can be found here: documentation
We chose this data set, because it has highly overlapping data and contains boolean values, which are necessary for the approach of our chosen paper. Our chosen data set can be found here