WordStream Dang et al. 2019 Documentation
Patrick Komon, 11808210
Victor Mittermair, 11809916
Introduction
Implementation / Extension of the WordStream project proposed by Dang et al. 2019. The project is a combination of WordClouds and StreamGraphs. Our goal was to enhance and extend the functionality of the project. We added the possibility to view WordStreams by state and added 3 new datasets to the project. We also made sure, that all the original functionality stays intact.
Our contributions
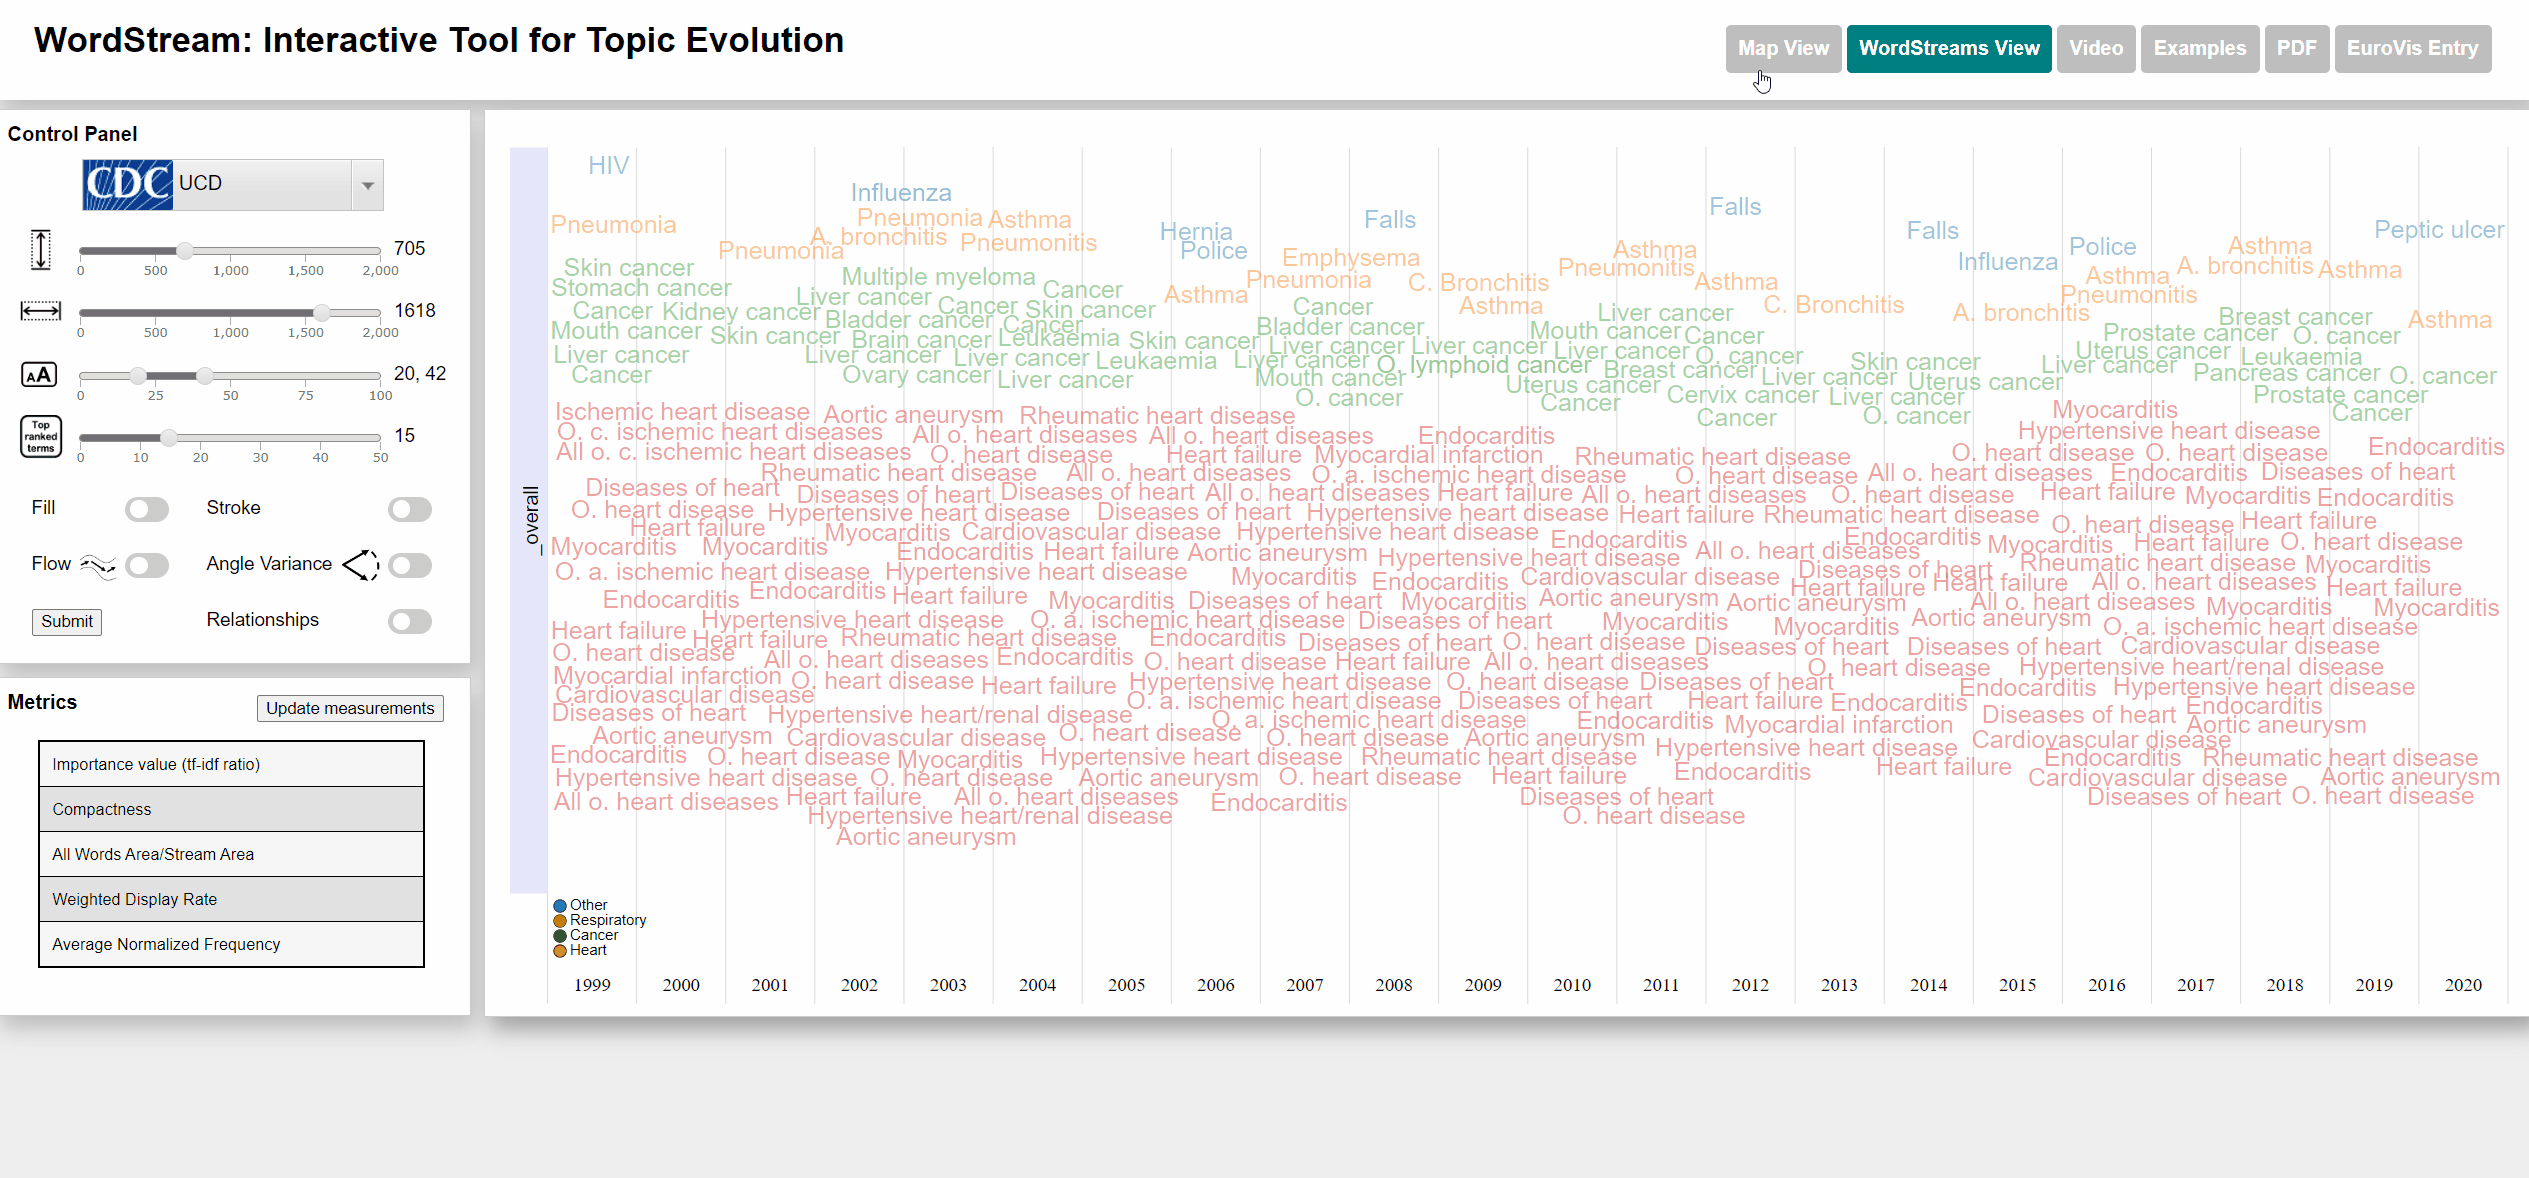
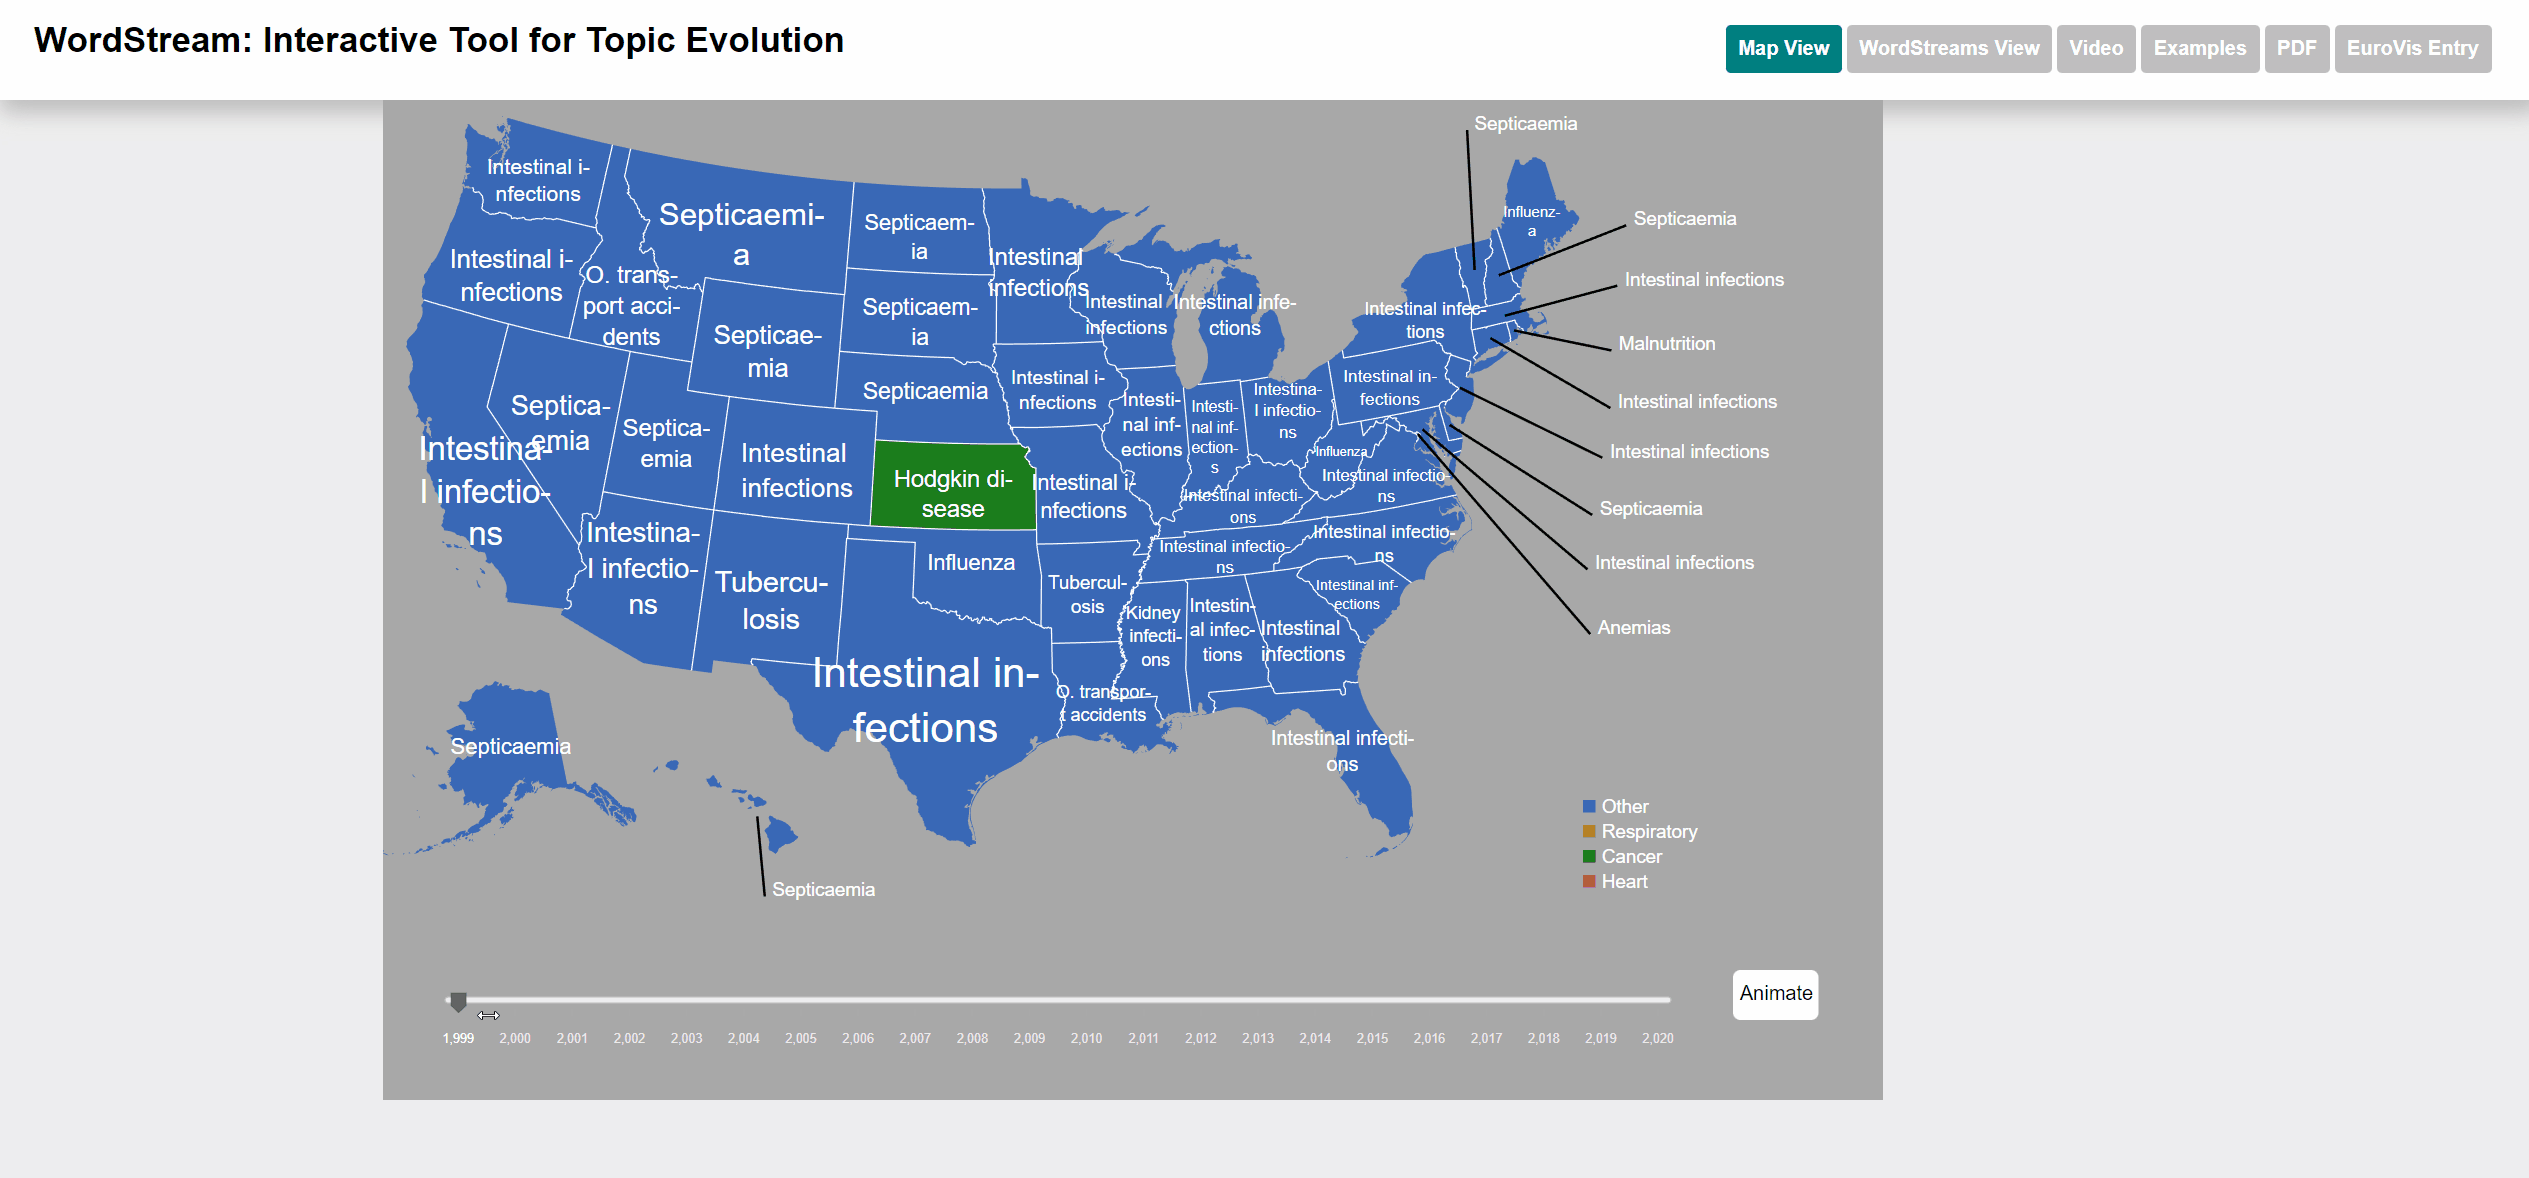
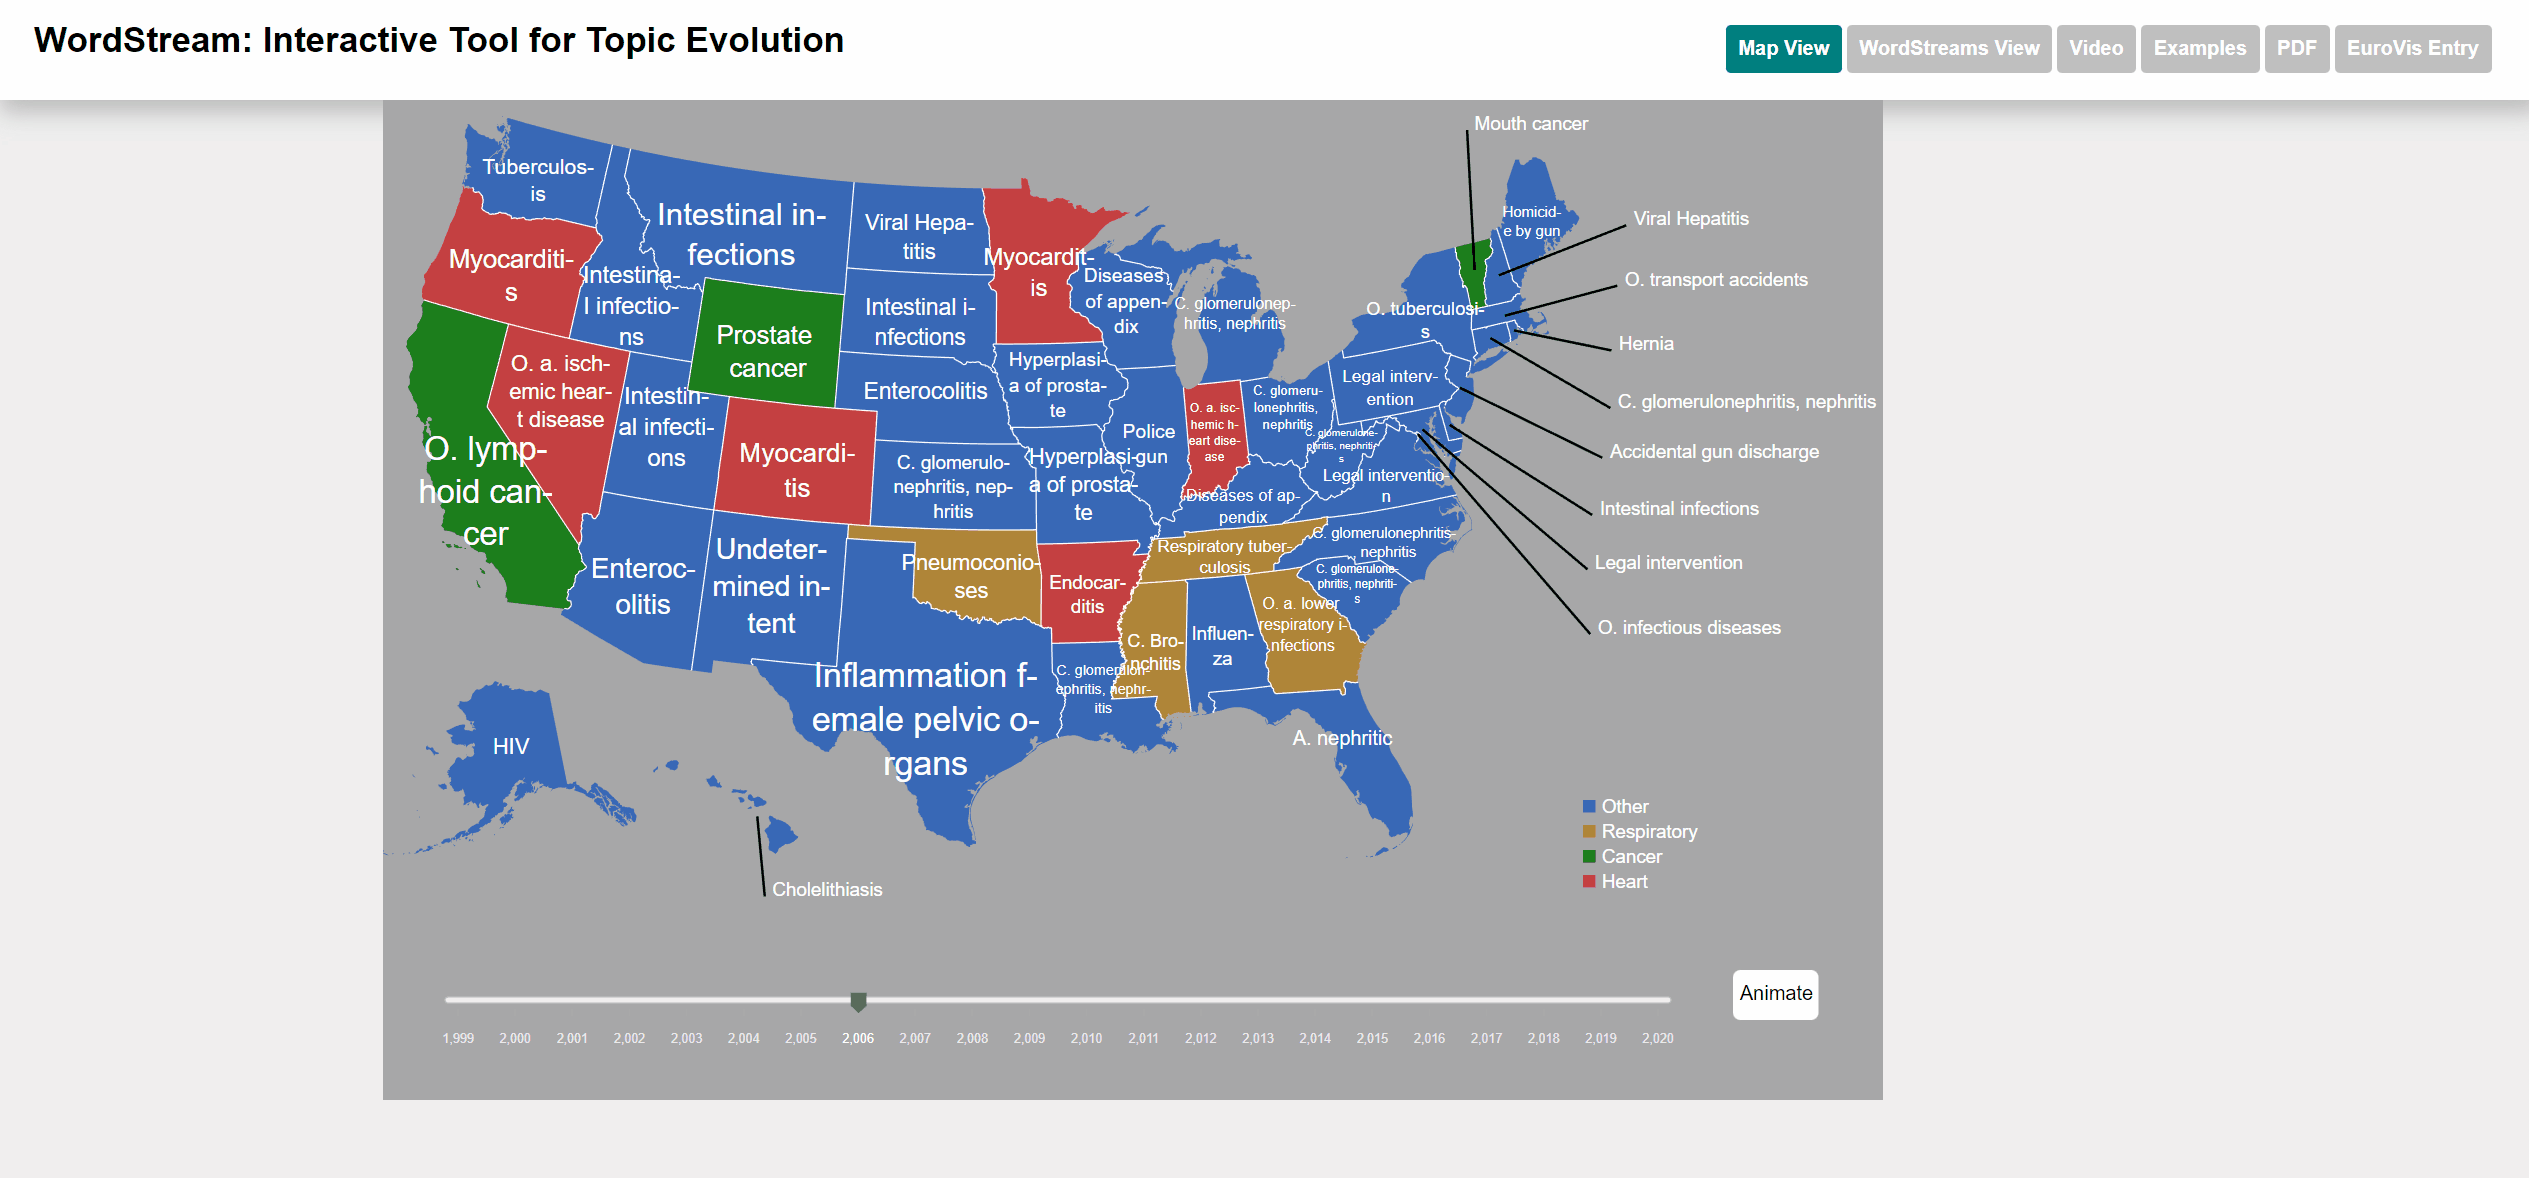
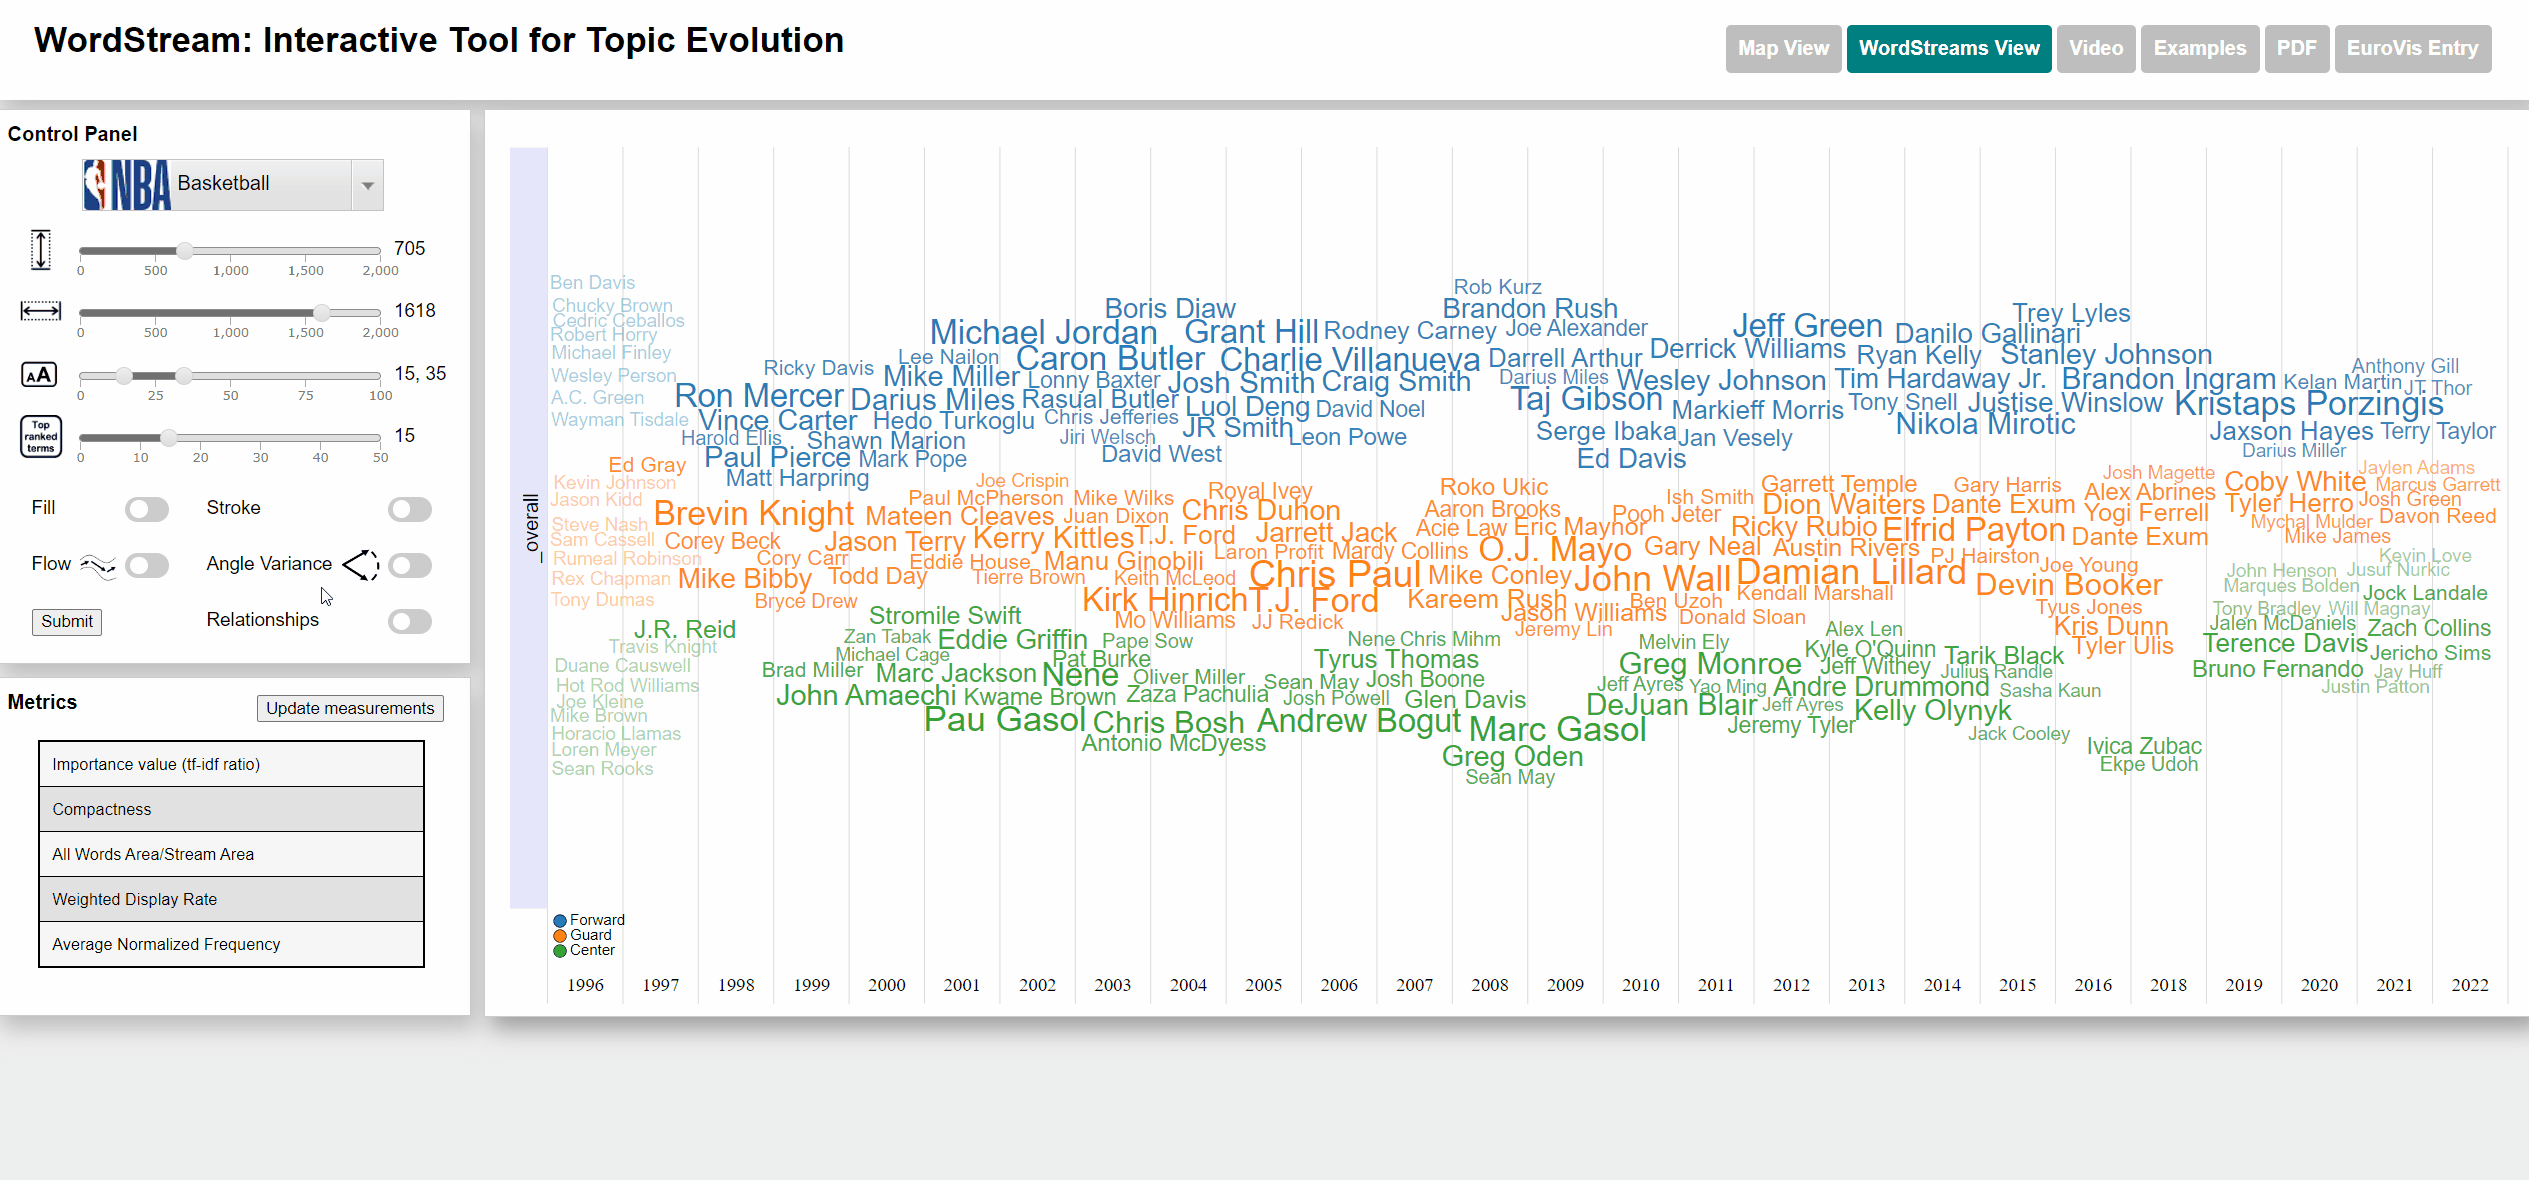
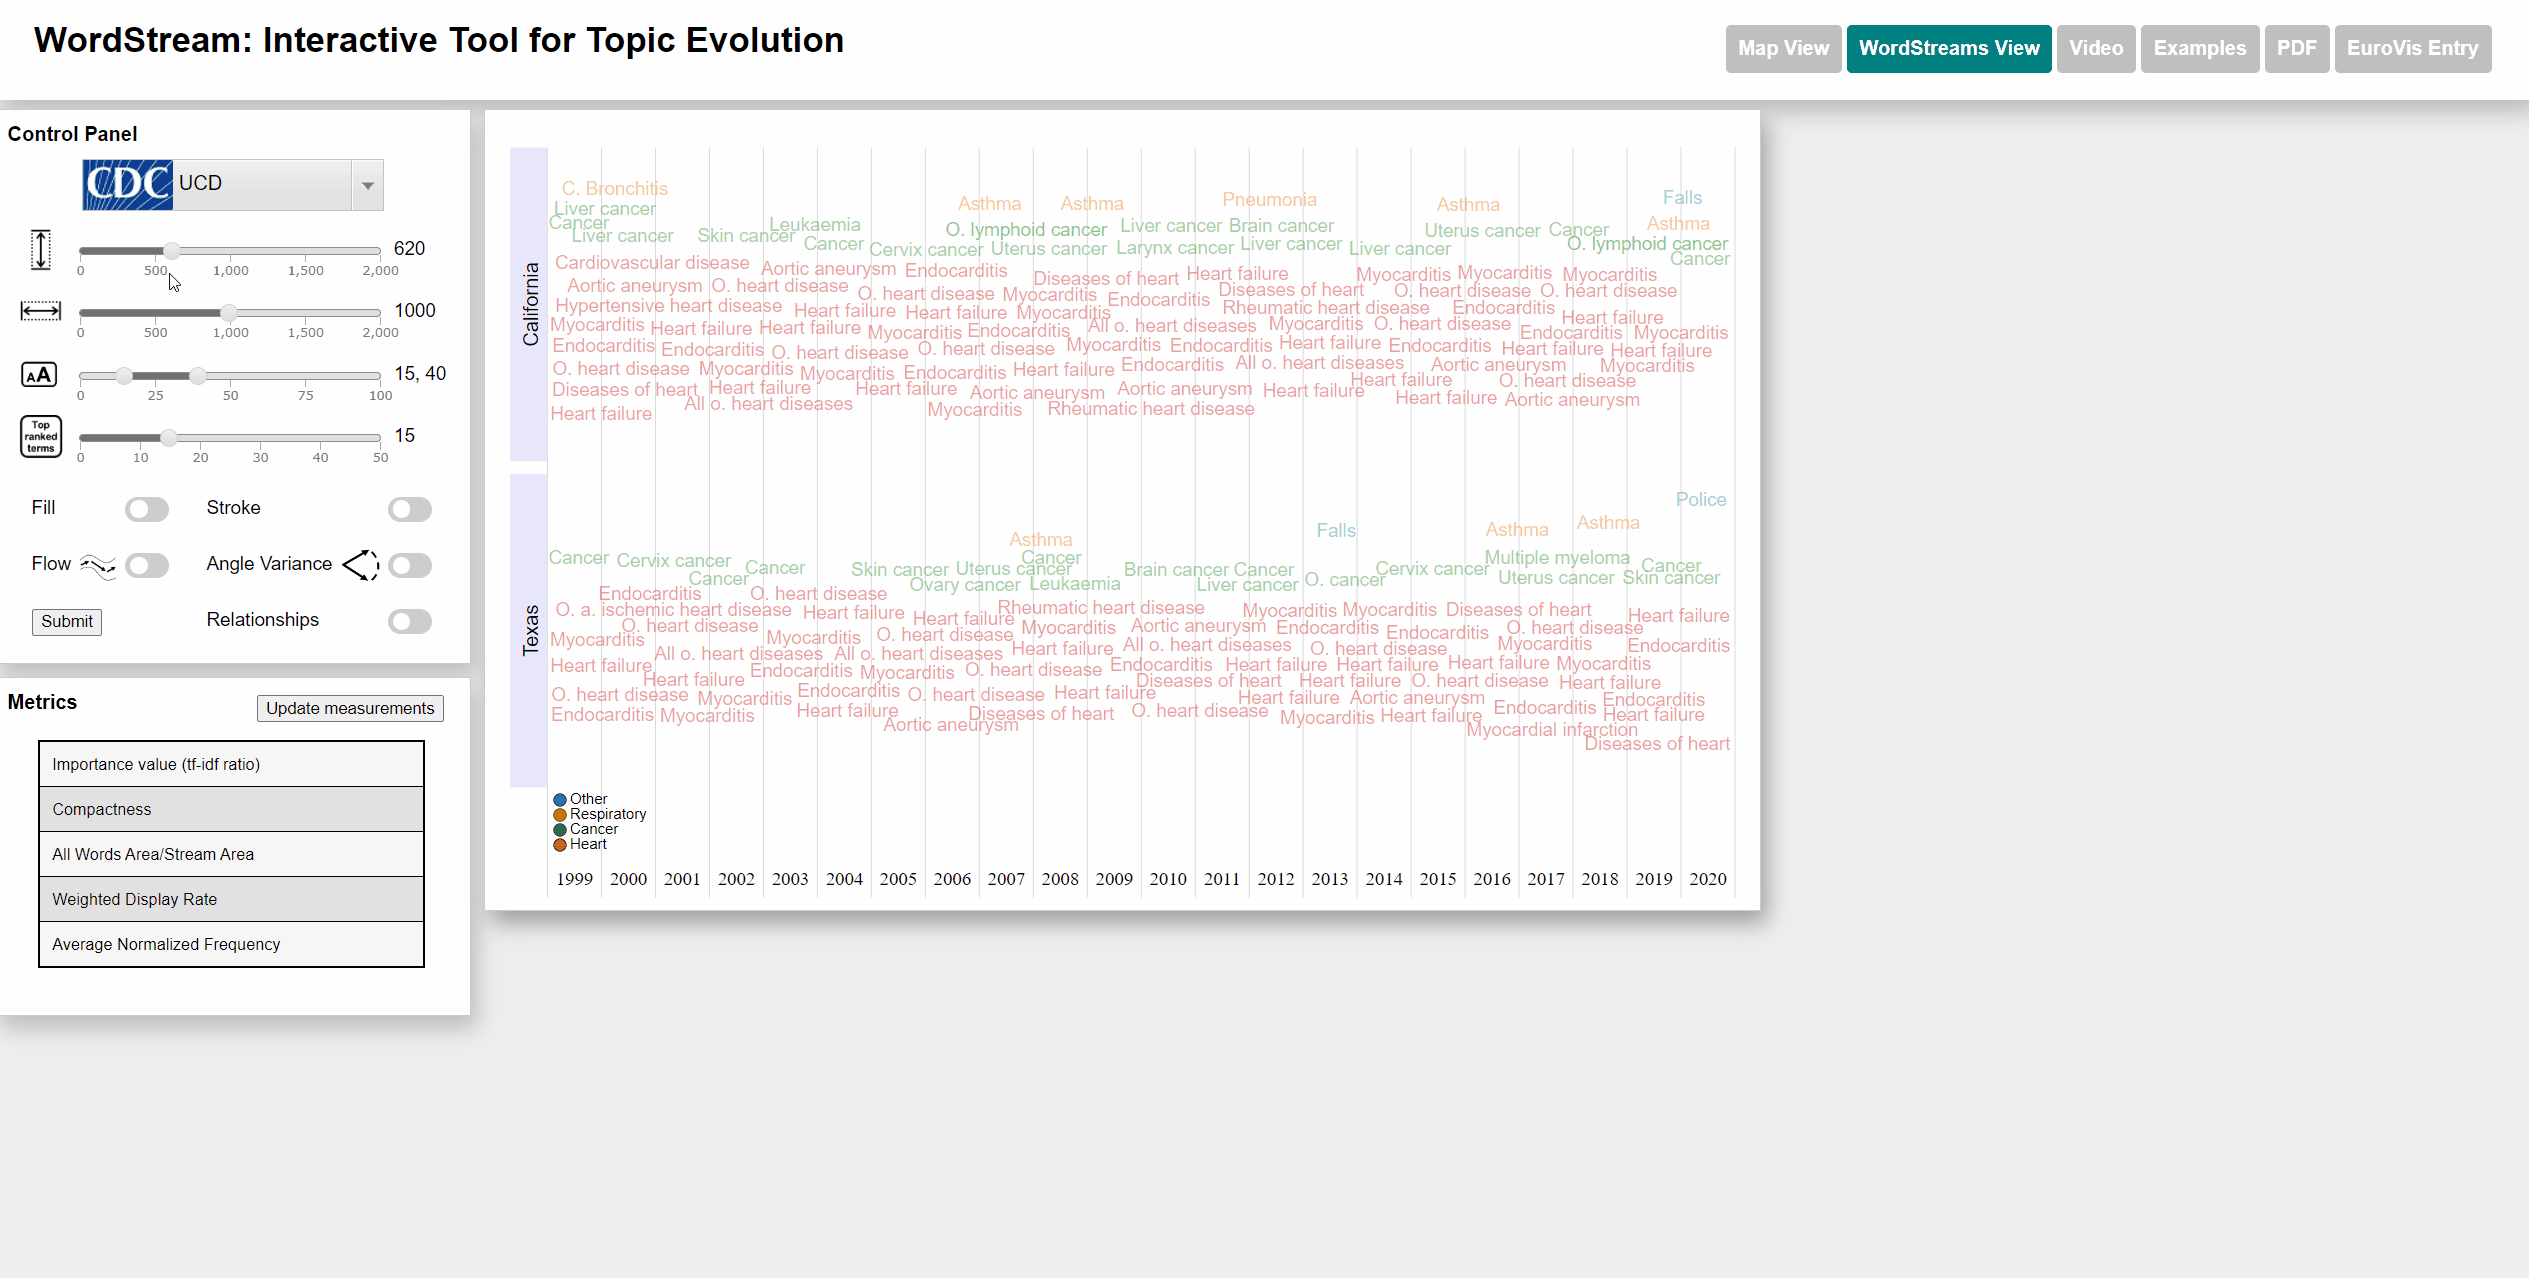
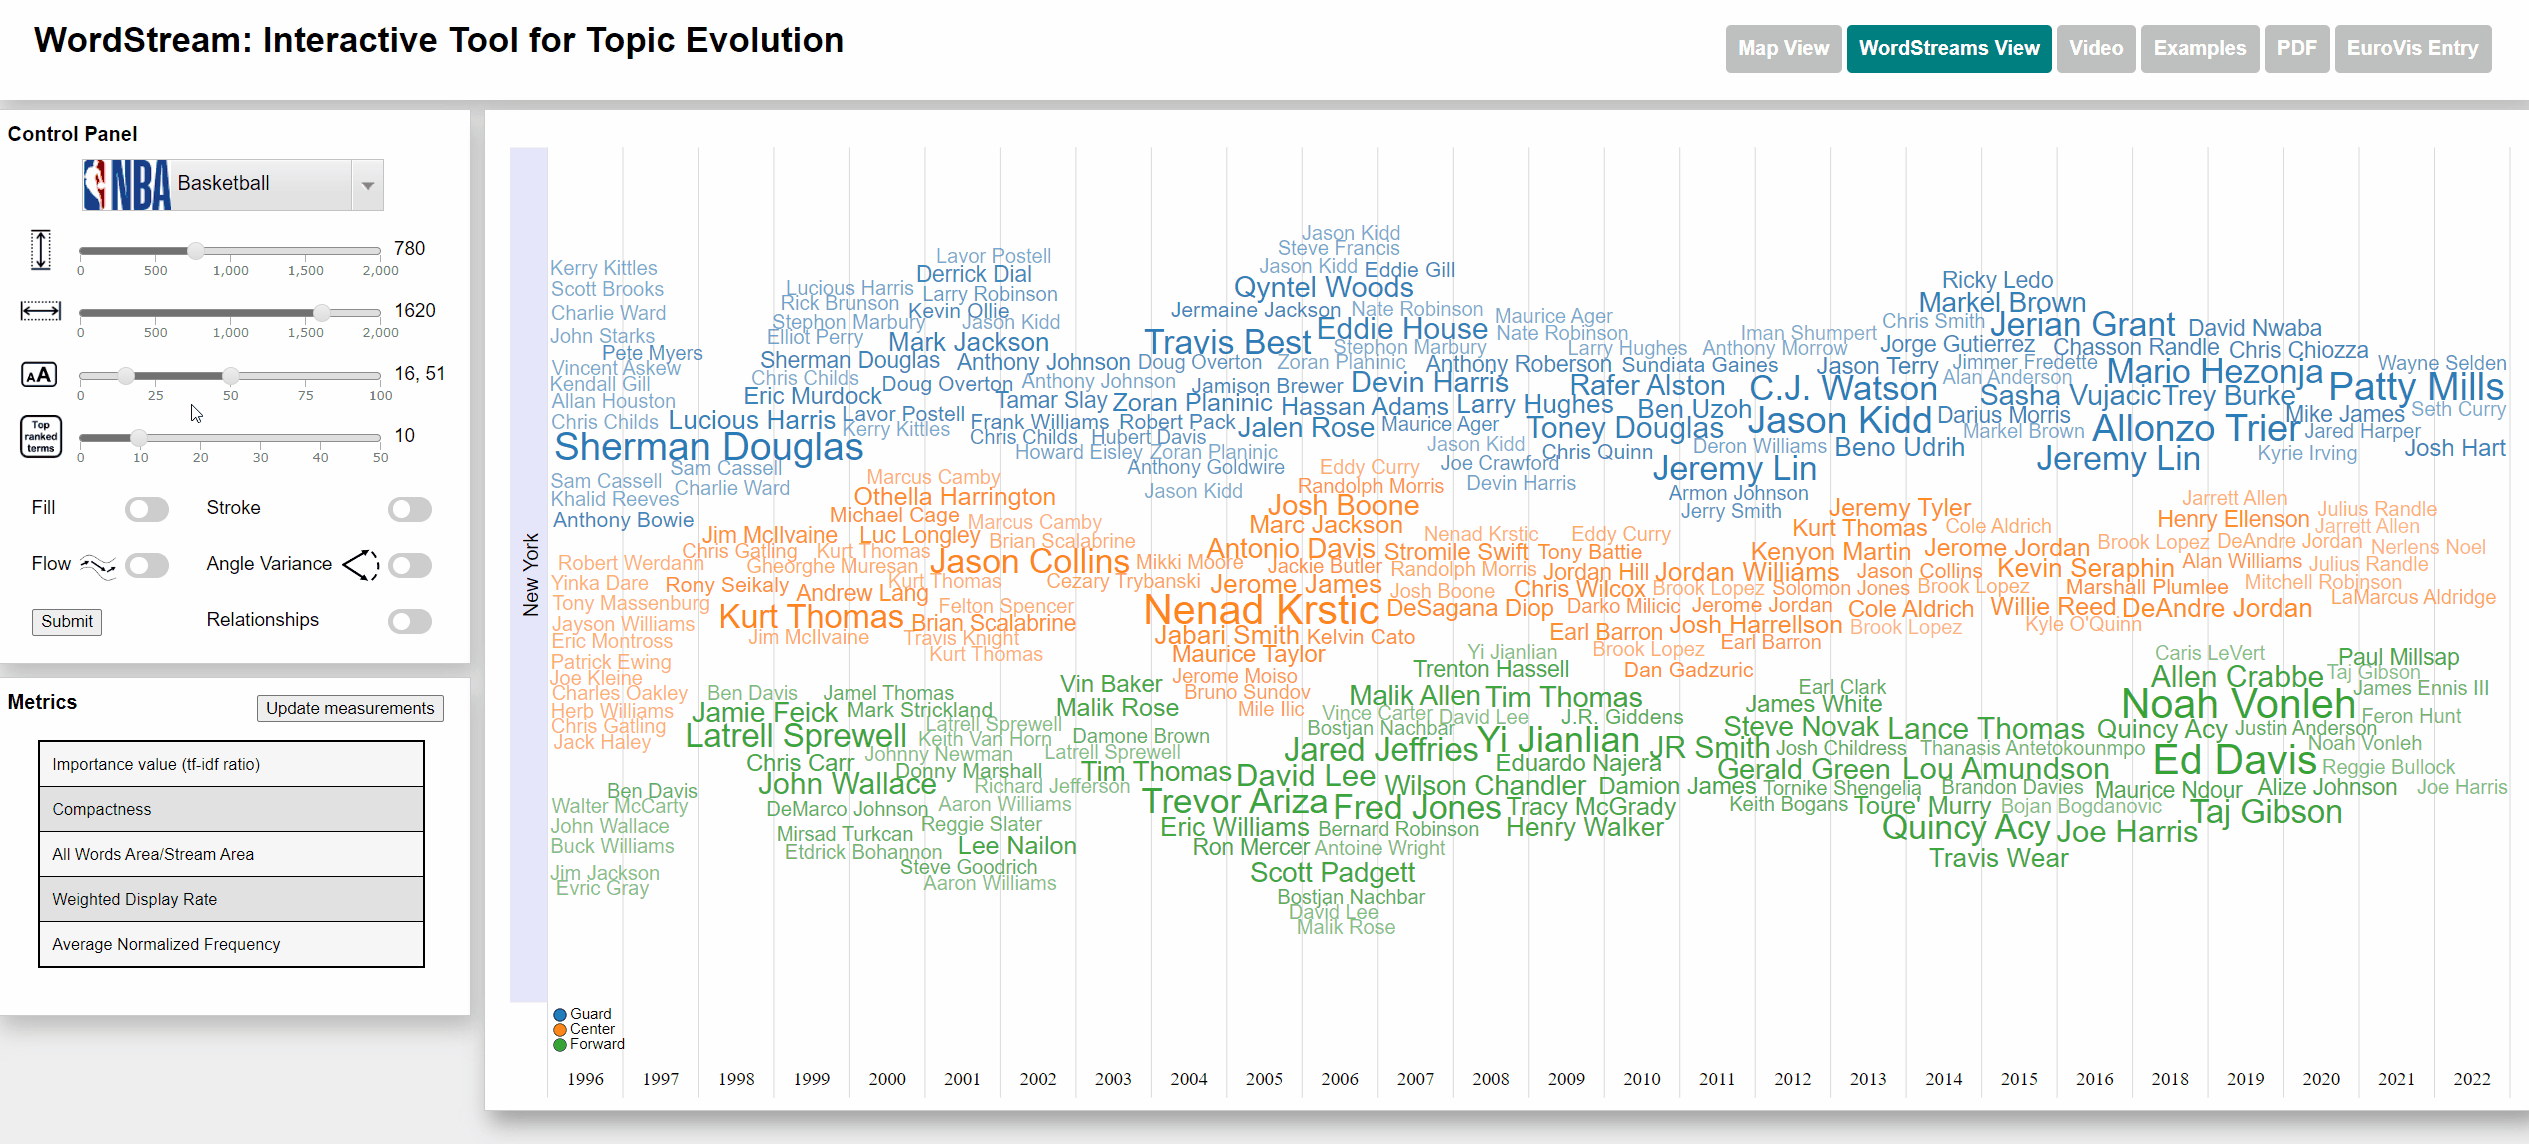
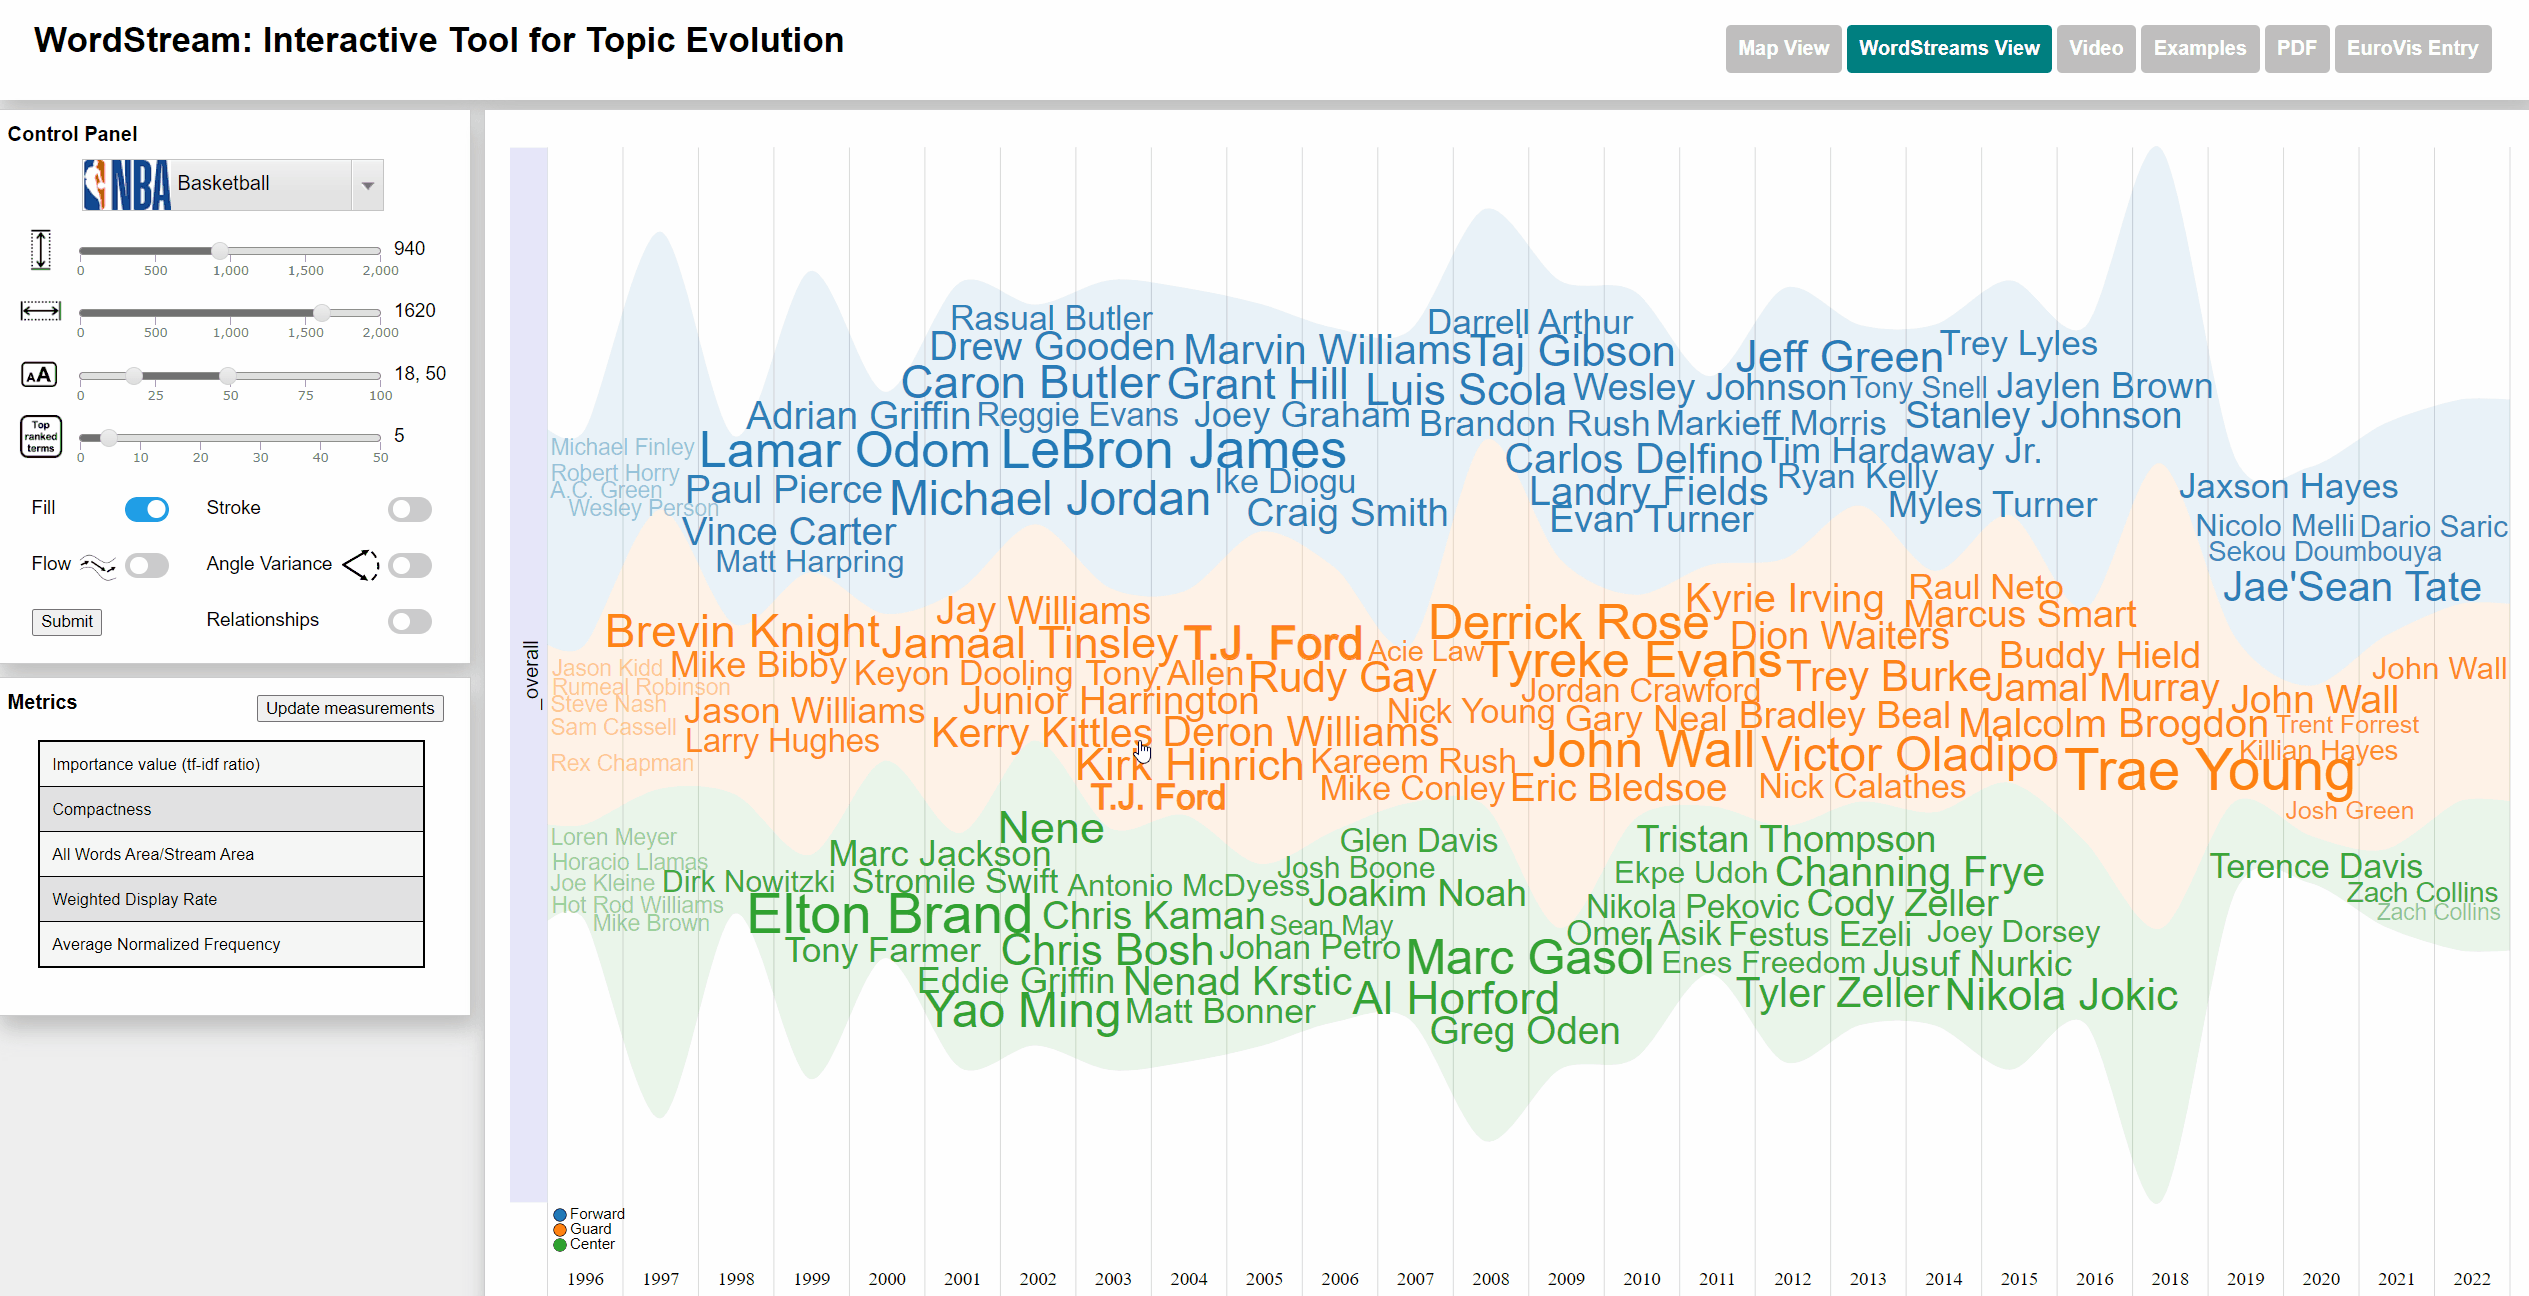
We extended the given functionality of WordStream by adding an option to view WordStreams by state. This means that the user can see the WordStream at a specific point in time for a specific state. This required new datasets that had data per US state. We found and processed 4 publicly available datasets:
- Underlying Causes of Death - CDC
- NBA Database and NBA Players and Performance
- National Notifiable Diseases Surveillance System (NNDSS) Data - CDC
To select states we used an interactive US map. The user can click on up to 4 different states and each WordStream will be generated for those states. We also added a moveable slider at the bottom of the map for the user to select the year for which the most important (sudden attention measure) word will be displayed. The user can also watch an animation going through all years. Each dataset has different categories that are color-coded for better distinction. Each state will be displayed with the category color of the most important word by year. We also added the possibility to view the underlying StreamGraph of the WordStream. In the WordStreams View, the user can change the fill and stroke parameters on the left control panel.
Usage instruction
Select one of the datasets with per-state data (Basketball, UCD or NNDSS). Per default, the WordStream for the entire dataset (including cumulative frequency and sudden attention measure for all states) is shown. You can switch to the map view, by clicking the "Map View" button that appeared in the header after dataset selection. Now states can add states to the selection by clicking them on the map. Then you can render the WordStreams of the selected states by clicking the "Compare" button on the right.
A common workflow for data exploration could be like the following
- Select a suitable dataset
- Go to map view
- Use the slider to find interesting most important words for specific states
- Look at the WordStream of a single specific state and/or compare it against the WordStreams of other states.
You can try the project out here.
Usage examples
Animation of the slider
Manual selection of the year
Selection of the states to compare
Changing fill and stroke parameters for stream graph visualization
Change width/height of WordStream canvas
Change min and max font size
Viewing frequency of words
Notes on datasets
Basketball dataset
The Basketball dataset consists of the play-by-play records of a large number of Basketball games played within NBA (National Basketball Association) seasons from 1996 to 2022. The number of appearances of each player was counted and used as term frequency (subsequently used for calculating the sudden attention measure). Each player is associated with a specific state by the team for which they played within a specific season. The five player positions (Power forward, Short Forward, Center, Shooting Guard Point Guard) were changed to just Forward, Center and Guard.
Because the dataset we originally selected, NBA Database, did not contain positions for most players, we pulled the positions from another dataset, NBA Players and Performance.
Terms with a high sudden attention measure usually are players, who are new to a team and often took part in actions throughout a large number of games within their first season.
Underlying Causes of Death (UCD) dataset
The Underlying causes of death - CDC dataset is published by the Centers for Disease Control and Prevention, a national public health agency of the USA. The UCD dataset contains the numbers of deaths caused for each specific cause per each US state and year. The list of causes is specified by the ICD-10 113 Cause List, an international standard for causes of death classification (in its version adapted by the CDC). The name of each cause is used as term and the number of deaths as term frequency.
Terms with high sudden attention measure are those causes, which were responsible for a larger number of deaths than in the year before. The effect of COVID-19 can be seen clearly in the dataset.
National Notifiable Diseases Surveillance System (NNDSS) dataset
The National Notifiable Diseases Surveillance System (NNDSS) Data - CDC dataset is published by the CDC as well. It contains the names and occurrences of certain infections diseases that must be reported to the CDC. The name of each disease is used as term and the number of occurrences as term frequency.
Terms with high sudden attention measure are those diseases, which were reported more often than in the year before. The effect of COVID-19 can be seen clearly in the dataset.