Edge-Path Bundling
Adam Höfler 11847620
In this project, a new approach for edge-bundling was reproduced. Edge-bundling is the technique of combining edges in a network graph in order to reduce the visual clutter for the observer and make the underlying trend clear and obvious to
understand. Edge-bundling approaches so far had one of two issues: 1) introduction of ambiguities 2) underperforming bundling. Ambiguities are introduced, when two edges are bundled in such a way that the connection of the respective nodes in the
network is not clear anymore and connections between nodes are formed that aren't connected in reality. Some edge-bundling approaches try to avoid this but may result in an underperformance in the number of bundled edges. The new approach
introduces a new approach that only bundles edges when the nodes are otherwise connected in the network and thus gets rid of the ambiguity issue.
The implementation technique was implemented in two steps: 1) performing the edge-bundling in Python separately from the visualisation since it can take a long time. 2) Visualisation of the new network graph using d3.js.
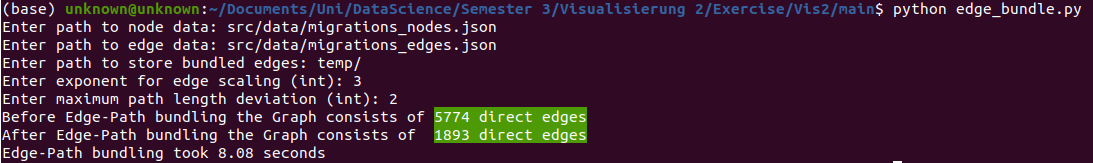
Two different data sets are chosen. Air traffic within the United States of America, it contains overall 235 vertices and 2.101 edges and is the same one that was used in the paper. County-to-County migration flow within the U.S., it contains
more than 5.700 edges and nearly 1.800 nodes - the data used in the paper was not available which is why own data gathering and aggregation as necessary.
Edge-Bundling
The first step involves the edge-bundling of the data using Python. Since this process depends heavily on the used data, manual data preparation is needed for each data set (as to give a usable
structure in the form of nodes and edges, as well as providing location data for visulization) and due to the non-real-time performance of the edge-bundling, the separation of bundling and visualization is well justified.The data is loaded
from a pre-defined location.
Visualisation
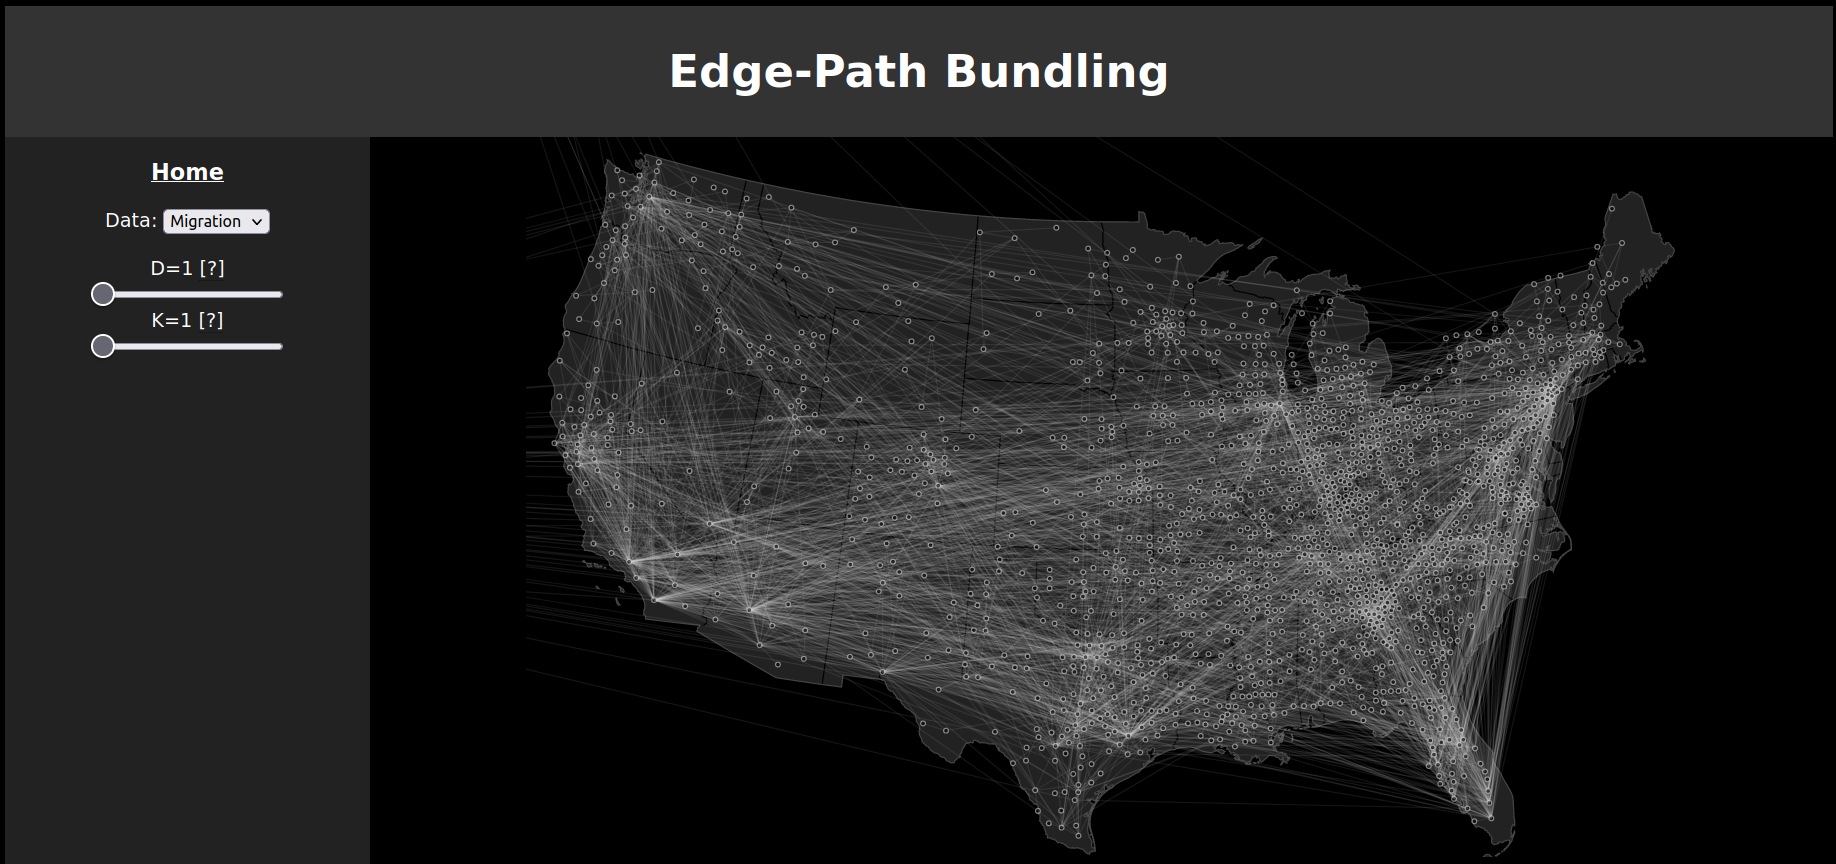
After the data is processed and the edges are bundled, it can be visualized using d3.js. Below, one can see the original data without any bundling taking place.
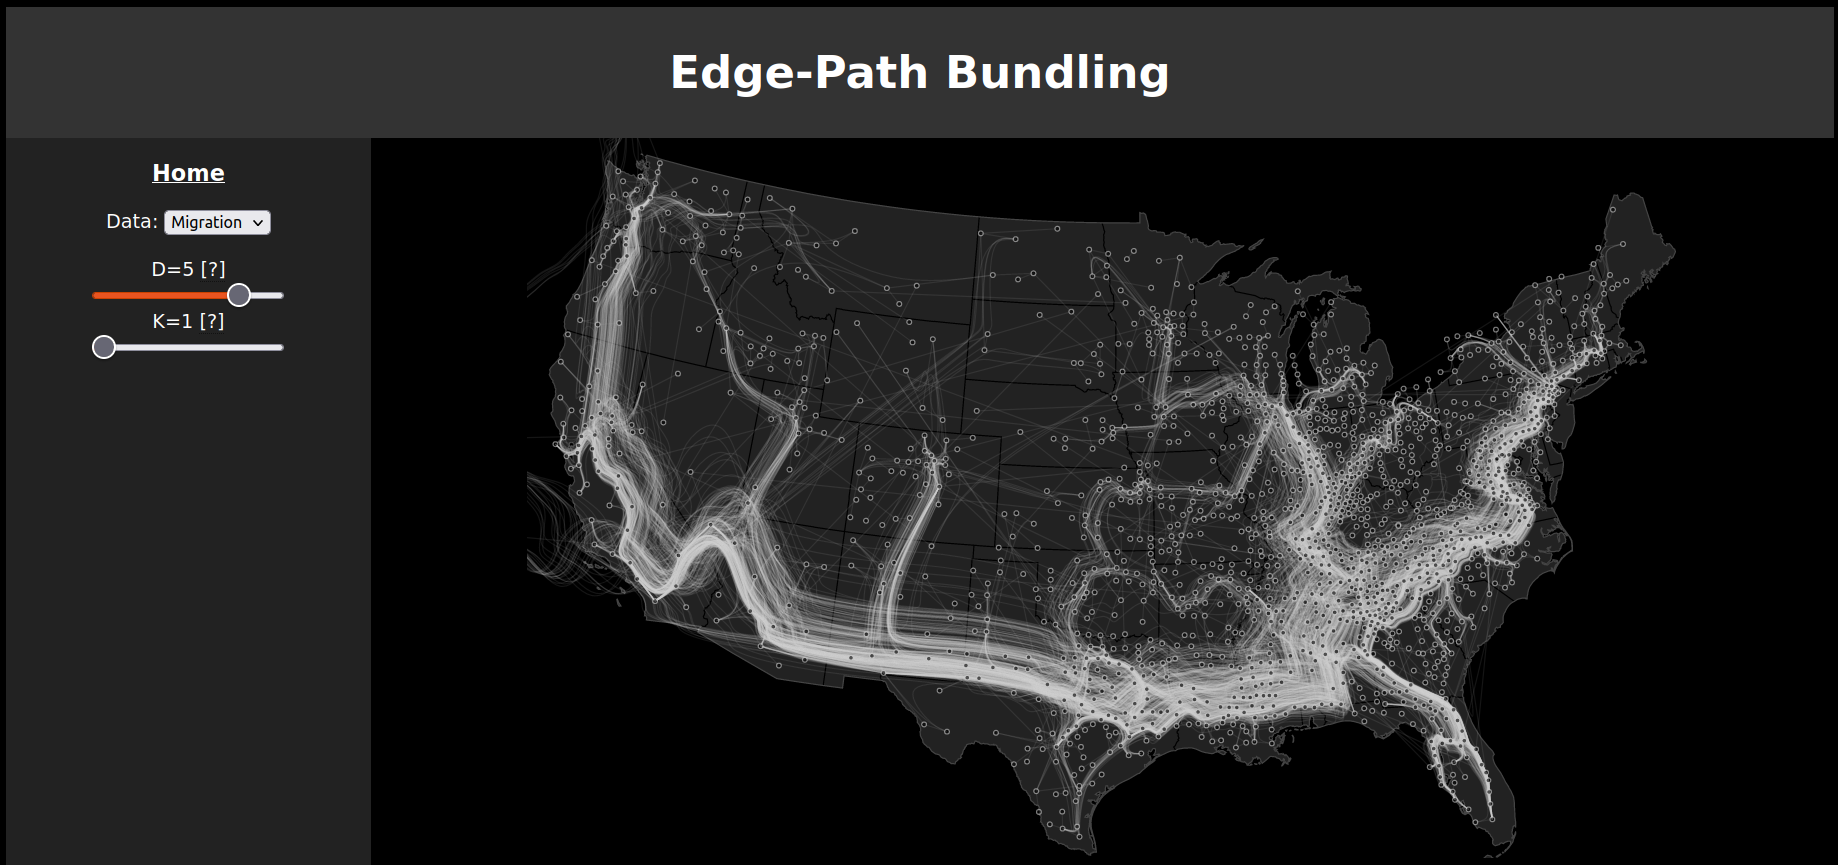
The sliders are setting two parameters d and k. The edge weight factor d scales the length of the edges of the graph by exponenting it - increasing this value has the effect that
more hops over shorter distances are preferred. The distortion k defines by which factor the bundled path is allowed to be longer than the direct connection.
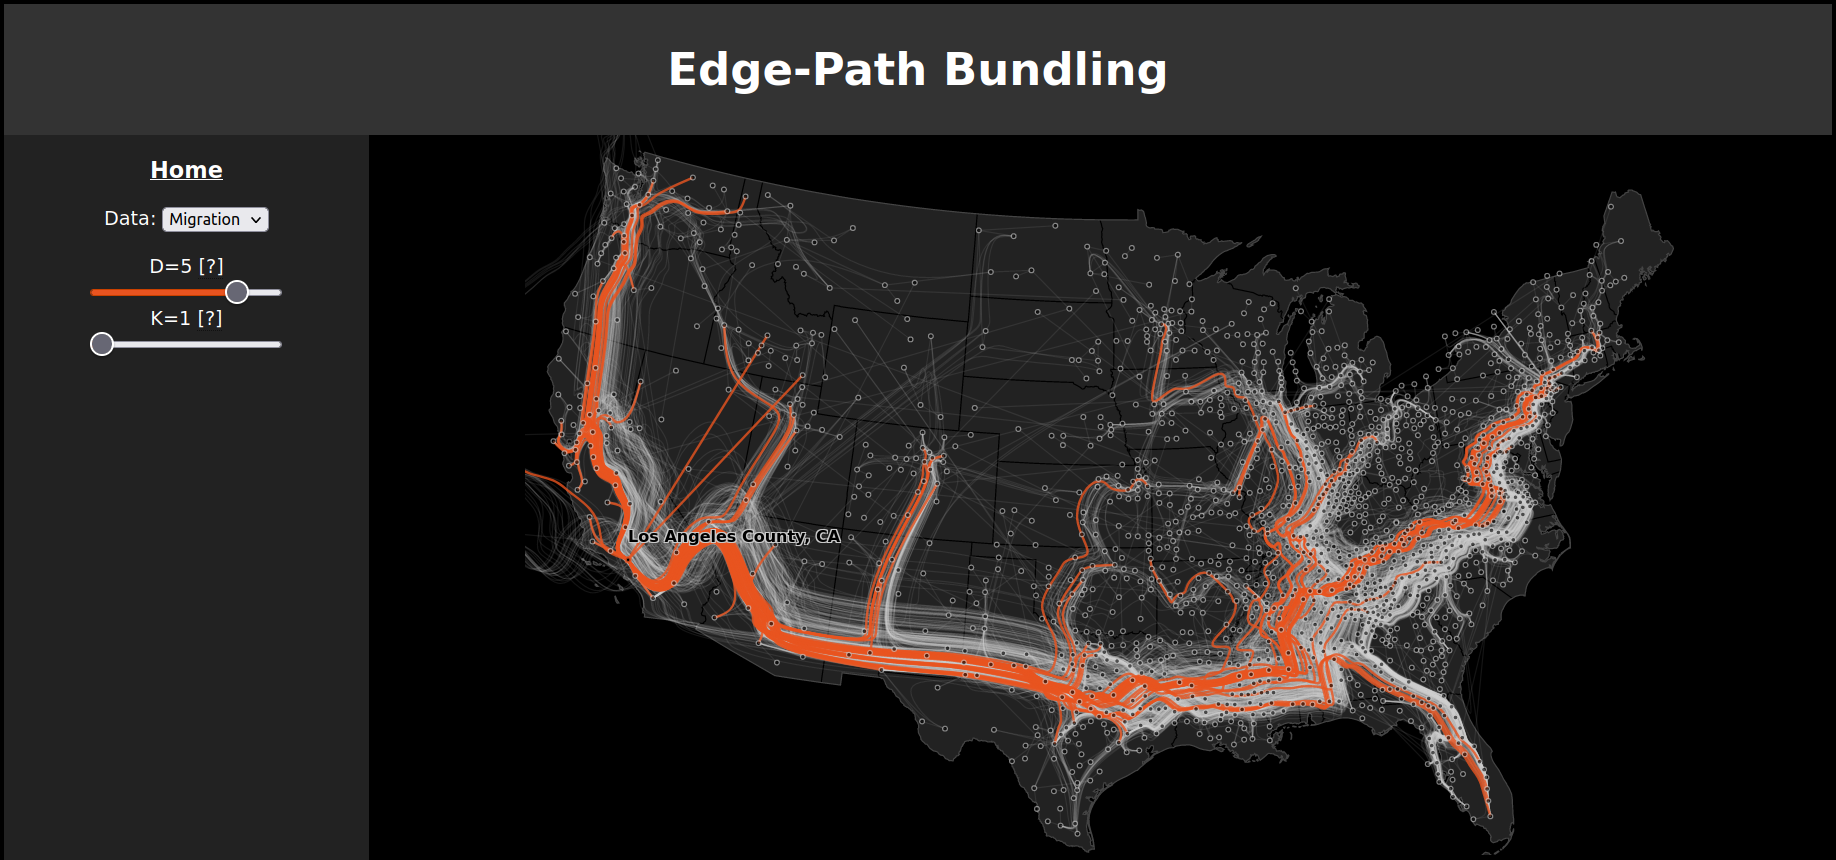
Highlighting of the paths is used to better understand the flow.
Further Links