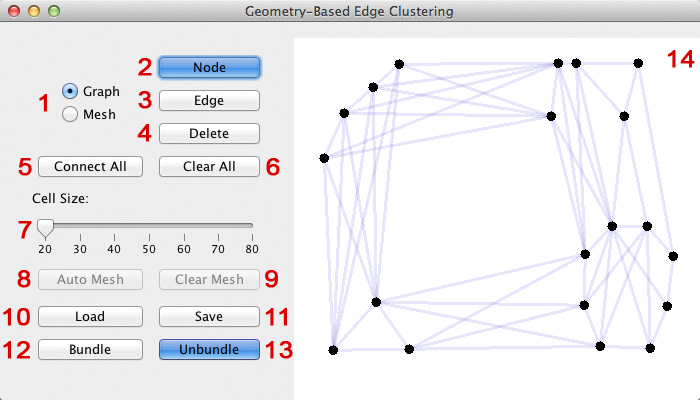
- Switch between graph and control mesh drawing mode. The control mesh will only be displayed in
control mesh drawing mode.
- Activate node drawing mode. When active, the user can place a new node by clicking inside the canvas.
Placed nodes can also be moved by clicking on a node and holding the left mouse button. The type of node
(graph or mesh) depends on the selected radio button (see #1).
- Activate edge drawing mode. When active, the user can draw a new edge by clicking on a node, holding
the left mouse button and dragging the cursor to another node. The type of edge (graph or mesh) depends
on the selected radio button (see #1).
- Activate deletion mode. When active, the user can delete nodes and edges by clicking on them.
Deleting a node will also delete all edges connected to it. The type of node/edge (graph or mesh) depends
on the selected radio button (see #1).
- Create a complete graph by connecting every node pair of the graph.
- Clear all nodes and edges of both the graph and the control mesh.
- Determine the cell size of the grid that is used during automatic control mesh generation.
- If there are edges of the control mesh drawn, the application will try to create a triangle mesh
by using the drawn mesh edges as constraints for Constrained Delaunay Triangulation. If there are no
mesh edges drawn, the complete control mesh will be generated automatically. Note: Depending on the
constraints, the triangulation may fail. If this is the case, the constraints can be used to bundle the
edges.
- Delete the control mesh.
- Load a graph from a gdf-File. Example files can be found in the data-folder.
- Save a graph in a gdf-File.
- Perform the edge bundling process. Both the graph and control mesh can still be altered while
bundling is active - the changes will be displayed in real-time. Deleting edges of the graph is not
possible however, as the click-detection only works for the original edges.
- Revert the edge bundling process.
- The canvas on which the graph is displayed.