Manual
As of the current version, our application is able to read local plain text and HTML files as well as remote HTML files. Use File -> Open File to load a local file or File -> Open URL to load a remote file.
In order to see something, you also need to specify one or more link words. A link word is a word (or any combination if characters) that links two words together. For example if you specify only one link word and the application will find find word combinations (so called phrases) such as Tom and Jerry (whitespace is added automatically). Link words can be defined via Filter -> Define link words.
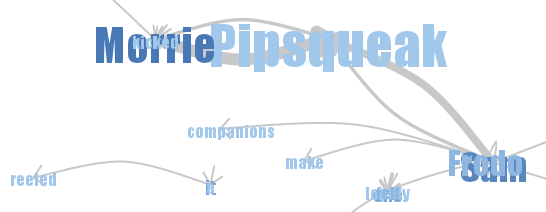
Once a data source and link words are specified, you should see a visualization of the text, as in figure 1. The visualization (phrase net) displays words that are linked by any of the link words specified, that is all phrases. The words are connected by arrows that describe the phrases, for instance in figure 1 you see that the phrase 'Morrie and Pipsqueak' appears more often than 'Pipsqueak and Morrie', because the arrow from Morrie to Mipsqueak is thicker. The size of a word indicates its frequency, i.e., how often it appears in any of the phrases (as in a tag cloud). The color of a word depends on its in-out-ratio r=o/i, where o is the number of outgoing connections (how often the word appears as the first part of the phrase) and i is the number of incoming connections. The higher the ratio, the darker the word. The proximity of two words shows how ,similar' they are: Words that often occur together are drawn closer to each other.
Depending on the data source and the link words, the number of found phrases can be very high. Our application provides ways to filter the phrases in different ways via the Filter menu. You can blacklist any number of words by using Filter -> Blacklist Words, which removes them from the visualization. How many of the most common words (words with the highest frequency) are displayed is specified via Filter -> Common Words. The default is 30, which means that the 30 most frequent words are shown, together with all words they form a phrase with. Finally, our visualization tool is able to detect many languages automatically and provides automatic filtering of common words that do not add information (such as ,he' or ,the'). You can toggle this automatic filtering via Filter -> Filter Stop Words.
Data Sets
An important feature of our visualization tool are data sets: Every time the data to visualize changes (because of data source, link word, or filter changes), a new data set is created and available from the Data Sets menu. The user can select any data set from the list in order to display it. This makes it easy to compare visualizations with different settings. Every entry in the menu describes the state of the corresponding data set: the name of the data source, specified link words and additional tags. These tags are: [n] if the data set contains only the n most common words, {f} if automatic stop word filtering is active, and {b} if one or more words are blacklisted.