Introduction
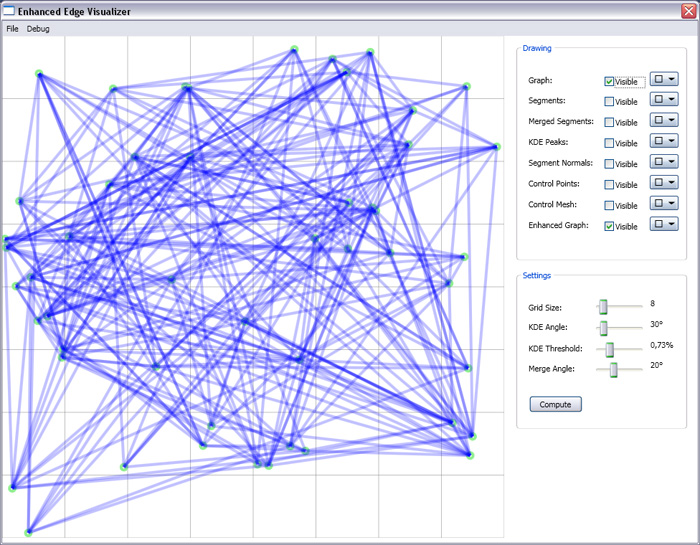
This image shows a straight-line graph without edge bundling.
The visualization of graphs with a large amount of edges is a difficult topic. Due to occlusions and edge crossings the result of directly drawing the graph is most likely not visually pleasing and confusing. Although there are methods to enhance the graph by moving the points, these methods are often not suitable because the location of the points encodes important information. Therefore [1] propose to bundle edges with similar directions. The main goal is to turn straight-line graphs into road-map-style graphs.
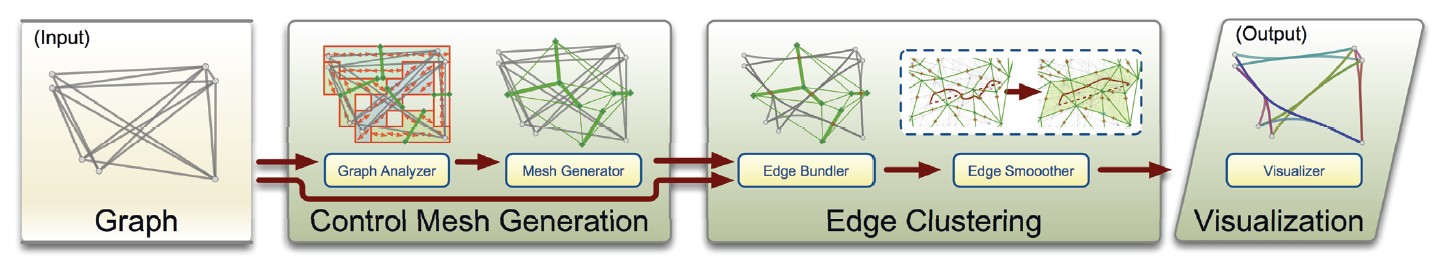
This image shows the several stage of the edge clustering algorithm [1].
The bundling is done by generating a Control Mesh and computing the intersections with the graph. These intersections can then be used to calculate control points. Eventually, the edges in the road-map-style graph are bundled by forcing them to pass through these points.
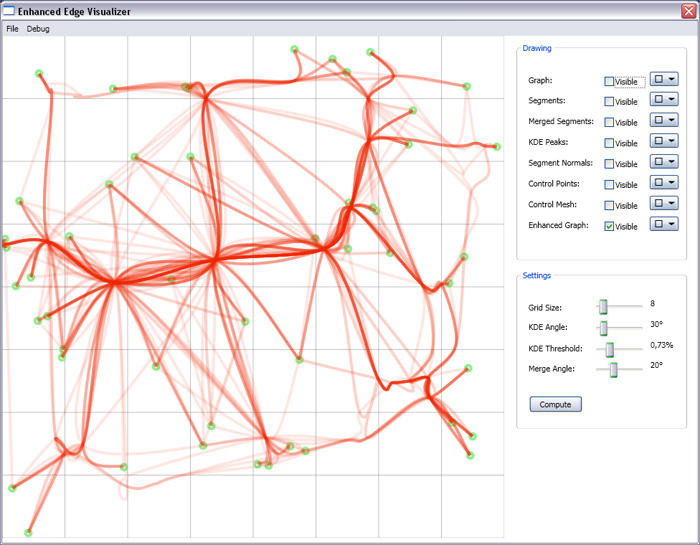
This image shows the same graph as above converted into a road-map-style graph using our algorithm.
[1] Cui, W., Zhou, H., Qu, H., Wong, P. C., and Li, X. 2008. Geometry-Based Edge Clustering for Graph Visualization.ĀIEEE Transactions on Visualization and Computer GraphicsĀ14, 6 (Nov. 2008)
(cc) Manuel Keglevic, Thomas Schulz
Created with the Freeware Edition of HelpNDoc: Full featured Help generator