User Guide |
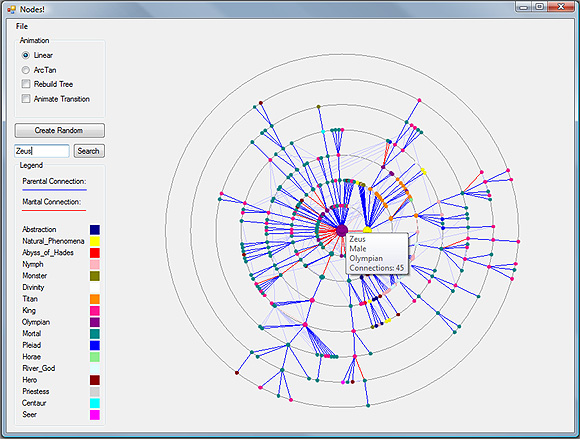
The User Interface After starting NodeVis, you have a variety of options to display a graph. Either you generate a random one by clicking the "Create Random" Button, or you open one of the datasets included with the program (/data/ Folder). by clicking "File". There is a small test dataset ("Test.nodes") and a dataset containing entities from the greek mythologies (like gods, kings, monsters, etc.) connected by their parental or marital relationships ("greek_gods.ego"). After you opened this dataset, you will see a screen like this:
At the right of the screen, you see the graph displayed as a tree on concentric rings, on left you see the user interface. The selected node is displayed at the center of the concentric rings. The position of the other nodes on the rings correspond to their distance to the selected node. On the left, you can set a few parameters for the animation process: The Create Random Button generates a completely random graph that will be displayed at once. By entering a search text and clicking the Search Button, you can search through the text fields of all displayed nodes. If the text is found, the corresponing node will be selected. When opening an .ego file, a legend will be displayed showing the color codes of the node classes and connection types.
|