The paper describes a new approach to visualize a compund graph, which is a combination of a hierarchy graph and an adjacency graph. This graph type is frequently encountered with many given data sets.
The hierarchy visualisation in this paper is done with some already existent hierarchy visualisation techniques, e.g. the balloon tree or the treemap layout.
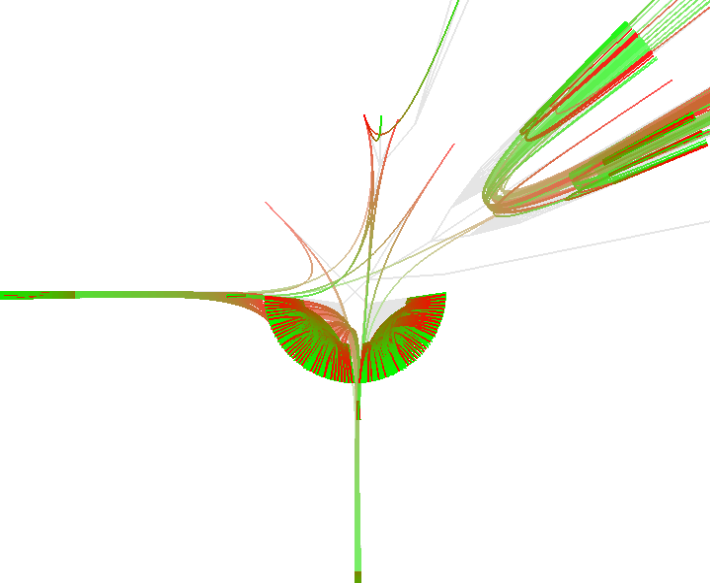
What this paper now describes is a new approach to draw the additional edges of the adjacency graph into the hierarchy graph. The author suggests using B-splines to avoid the visual clutter that is a result of only connecting the related nodes.
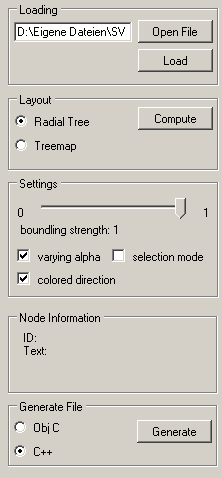
The application has it's own dataset-generator in the ui simply click on the generate button after you selected the source type you want to parse. Then navigate to the topmost directory that should be parsed, and there save a *.heb file. When clicking the save button, the parsing starts.
To display a dataset, simply click the open file button, then select the *.heb file you want to display. After that click load. Now the file is loaded into the memory. Next, you have to decide, which layout (radial tree or treemap) you want to compute and display. Depending on the graph size, this might take a while, because all the splines are computed during this stage.
Next you are able to navigate in the window with right clicking and dragging and rotating the mousewheel. By left clicking a node, you are able you display only the adjacencies where the selected node is a control point.
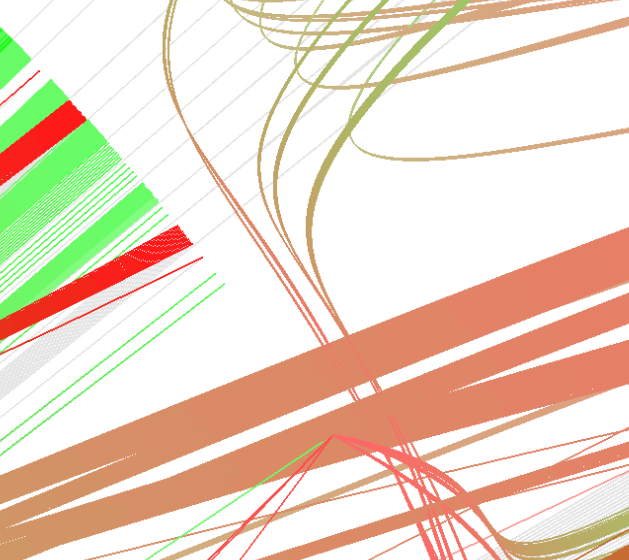
In the Settings panel the boundling strength of the splines can be changed by the slider, a color coded direction and alpha coding the lenght of the spline can be enabled.
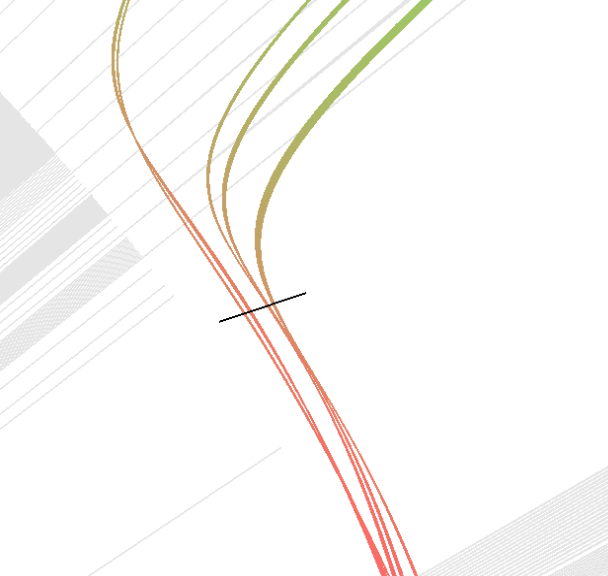
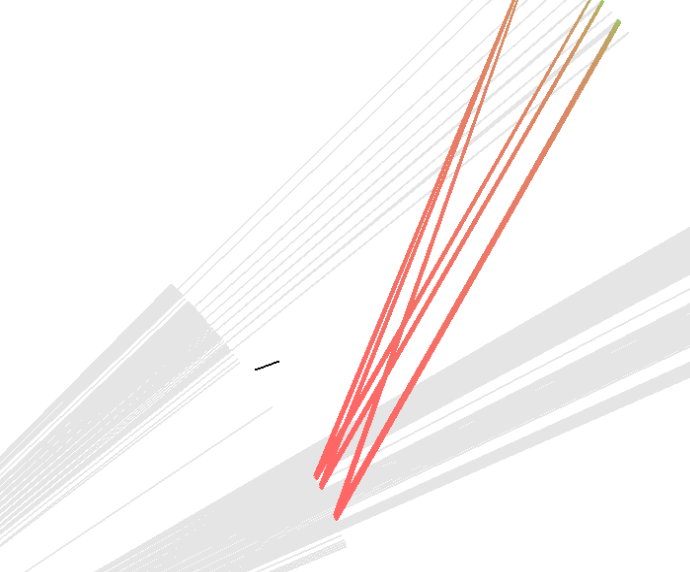
There is also a seperate selection mode, where you can draw a line by clicking two times into the panel, and every spline that is crossed by the line is displayed. This can be used to select a curve boundle, and then set the boundling strength to zero, to see the different adjacencies.
The whole program is written in C# and uses the Taoframework for displaying the data. The documentation can be found here and the whole program with some datasets can be found here
In the screenshot you can see at first some edge boundles, second the selected ones, which are drawn with boundling strength 0 in the third screenshot.