Infovis Uebung - Dokumentation; Mathis Csisinko, Michael Mehling
ARGL - Animated Radial Graph Layout
based on the paper "Animated Exploration of Dynamic Graphs with Radial Layout" [1]
Content
Introduction
Paper Overview
Implementation
More Screenshots
Links/Download
Reference
Introduction
ARGL (Animated Radial Graph Layout) is a visualisation tool for the exploration of large graphs in a radial layout. It is based on the visualisation technique described in the paper "Animated Exploration of Dynamic Graphs with Radial Layout" [1] by Ka-Ping Yee, Danyel Fisher, Rachna Dhamija, and Marti Hearst with some additional features not described in the paper. In the following, first a short overview of the paper and the key features of the visualisation technique described in the paper will be given. Then we will describe our implementation.
Paper Overview
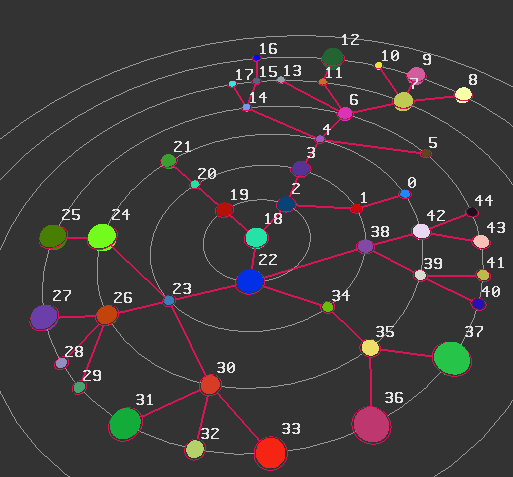
The paper presents a visualization technique of graphs based on a radial tree layout. It is well suited for visualizations of network structures where important properties are the relationships between entities, such as a nodeÕs degree of connectivity and the network distance between nodes. A graph based on the proposed visualization technique focuses on a single root node, which is located in the center. According to the radial layout technique, the other nodes are displayed in concentric circles around this root. In the technique proposed these concentric rings are intentionally drawn to better visualize each nodes network distance to the root node. In order to achieve interactive exploration - the key element of this paper - the focus of the graph can be changed by choosing another node as root. Because of the root centered visualization method the layout of the graph is determined by the currently focused node (root) and its relations to the other nodes. Consequently, focusing another node changes the layout of the graph. This is done interactively and the transformation is performed in a smooth animation. In order to minimize the users disorientation and confusion when focusing on a new node, the best possible consistency between the old and the new layout should be maintained. By trying to keep the relative orientation of each node in respect to the root as close as possible to the old layout, most nodes should - simply said - not move too much. During transition between two views rotational travel of nodes should be minimal and edges should not cross over. This is achieved by applying certain constraints during creation of layouts. These constraints are especially relevant for layout generation at each instant of the animation between different views.
Implementation
For the basic features (calculation of new graph layouts when selecting a new focus node, animation behaviour, and navigation) we implemeted the techniques as described in the paper. Furthermore ARGL has some additional features not mentioned in the paper, such as a 3D-view, a fisheye-effect and the possibility to switch between different views (orthographic and perspective). Several parameters that control view and animation can be modified by the user at runtime via a graphical user interface (GUI).
User Interface and GUI
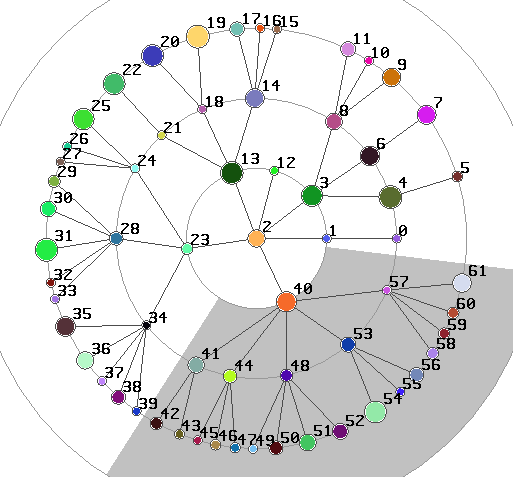
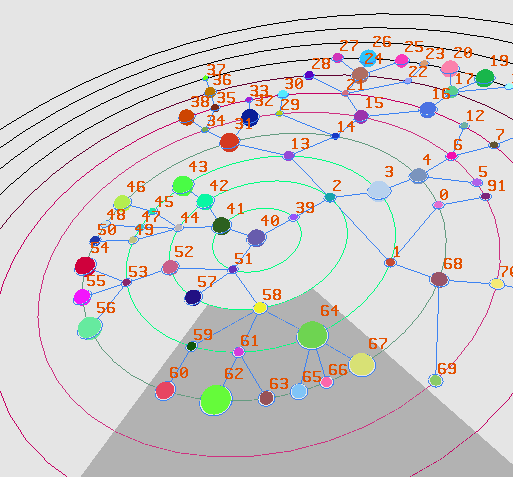
Interaction with the application is simple and straightforward. The display window shows the graph with the current node in focus drawn in the center. By left clicking on a node, this node is selected as the new node in focus (new root). The animated transition from the current graph layout to the new layout is started. Jumping from a more peripheral node directly to the root node can be disorienting for the user. Therefore, if the new focus node does not lie on the most inner ring (i.e. the new focus does not have a network distance of 1 to the old root node), a series of transitions between intermediate (temporal) focus nodes is performed along the path in the graph from the old focus node to the new focus node. When rolling over a node with the mouse, the sector that is assigned to that node is displayed, so that a nodes subtree and how much space of the complete ring it covers can easily be seen, see the picture below.
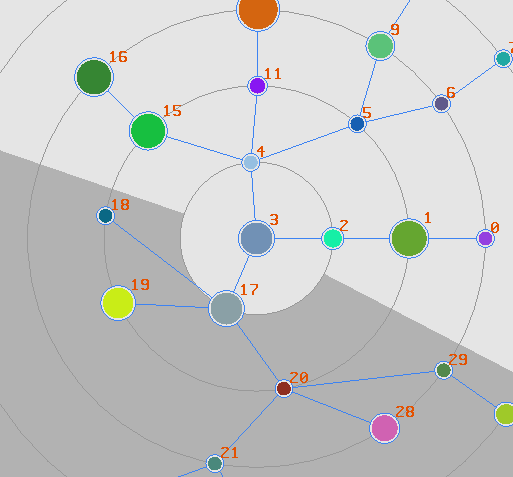
the sector assigned to a node is displayed at roll-over
By holding down the SHIFT-key and the right mouse button while moving the mouse up or down (i.e. moving the mouse in the y-direction), it can be zoomed in and out. By default the view is two dimensional (with an orthographic camera looking perpendicular at the scene). By moving the mouse in x and y-direction with the right mouse button pressed camera pitch and yaw are modified.
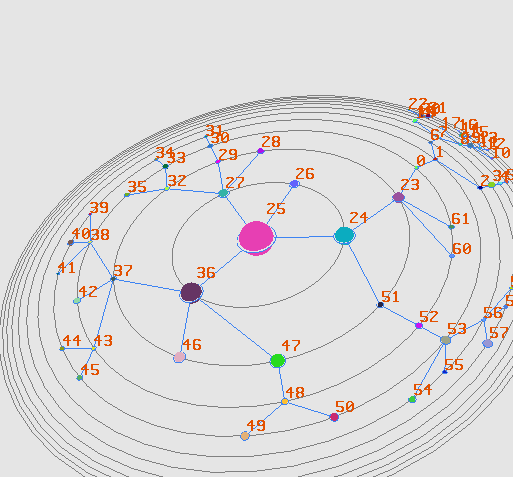
Several parameters for animation and visualisation can be controlled via the GUI, for a screenshot see the picture below. Via the slider "Keyframe steps" the number of keyframes of the transition animation between two graph layouts can be set. The slider "Keyframe time" lets control the duration (in seconds) of one transition animation. A smaller value thus results in a faster animation. The slider "Slow-in-slow-out-behaviour" can be used to determine how strong the slow-in-slow-out-effect for the animation will be. A value of 0.0 results in a linear interpolation between the graph layouts. With a very high value, the animation will start and end very slowly, the linear interpolation in between slow-in and slow-out phase will be very fast. With the slider "Fish eye view" a fisheye effect for the camera can be controlled. Again, with a value of 0.0 (what is the default value) no fisheye effect is visible, the higher the value the more distorted gets the view. With the color selector "Ring colors" several colors can be selected. Colors are linearly interpolated and assigned to the concentric rings around the focus node. With that feature the network distance, denoted by the rings, can be made more visible by applying a color gradient from the centre to peripheral rings, see the screenshot below Choosing between an orthogographic and a perspective view can be done by switching the two radio buttons "Orthographic" and "Perspective".
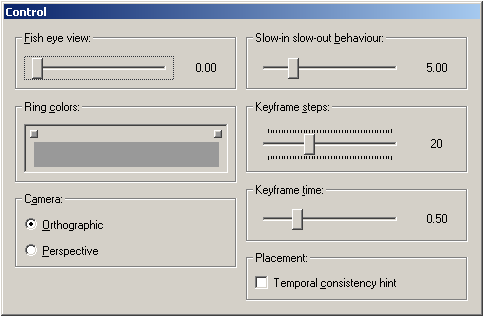
screenshot of the GUI
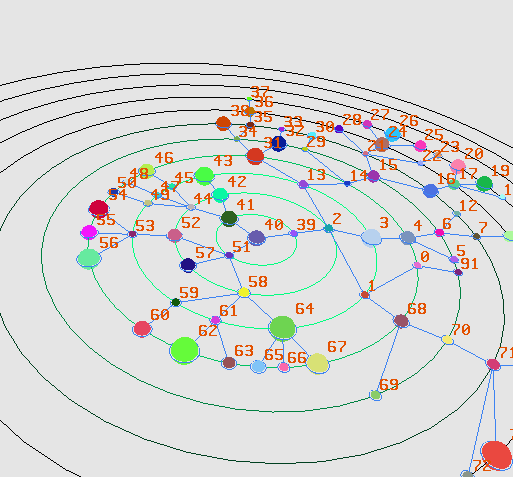
with the differently colored rings the network distance can be made more noticeable
Datasets
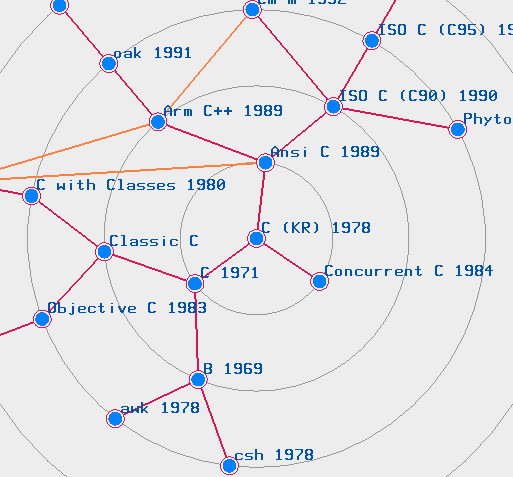
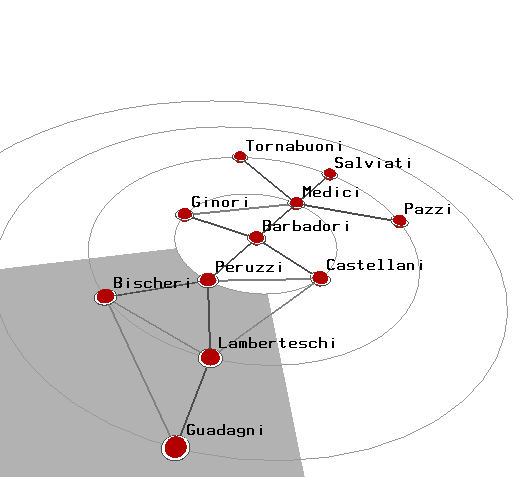
Datasets can be loaded via xml files with a specified structure. Each node has a name, which is supposed to be unique. Further attributes are the node's weight and optionally a color. A node can have any number of child nodes and (for graphs with non spanning tree edges) references to other nodes in the tree, this node has a non child connection to. For referencing other nodes, the nodes' name are used, therefore names should be unique for graphs with non child edges. An example that shows the xml structure is shown below.
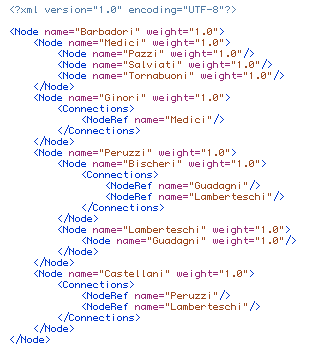
Example of a data set file
StyleSheets
When started, ARGL displays the graph in a default style. However, the visual appearance of the graph display can be controlled by applying different style sheets. These can be loaded as xml files. Attributes such as the default node color, the color of edges and non child edges, background color, circle and edge color and width, etc. can be modified. An example of such a styleguide (which contains the application's default style) is shown below.
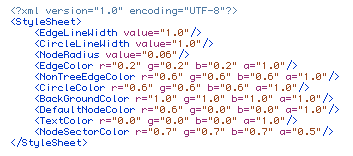
Example of a stylesheet file
The xml structure is rather self-explaining. The NodeRadius describes the radius a node with a weight of 1.0 has. Color values are given in RGBA with the range for each color going from 0.0 to 1.0.
TreeGen
For testing the application with different datasets we wrote a little console application that generates random trees. The maximum number of childs a node can have, the maximum depth of the tree, the maximum size a node can have and a boolean flag, whether the nodes are being assigned a (random) color are passed as parameters. The program then randomly generates a tree and writes it to a xml file. The filename contains the number of nodes (for example "random_col_79_nodes_159b.xml" for a graph with colored nodes or "random_132_nodes_7386.xml") for making testing easier. Trees of different sizes can be generated by modifying the maximum childs and maximum depth parameters.
Technology
ARGL is programmed in C++ using MS VisualStudio 8. For rendering we use OpenGl, the GUI is based on the Windows API. The only further additional library we use is TinyXML for reading xml files.