|
We use GTK+2, PyGTK and Python for our implementation.
The main program resides in infoviz.py; This file contains the whole source
(except the plugin sources), which may sound a bit odd. However, at the
time we wrote this we had 499 LOC for the whole program, so not too much
for one file.
The paradigm we use is the Model View Controller (MVC) paradigm. The
'model' are the Node and Circle classes, that represent the data we
visualize. The View is handled by the GUI class, the controller by the
Controller class.
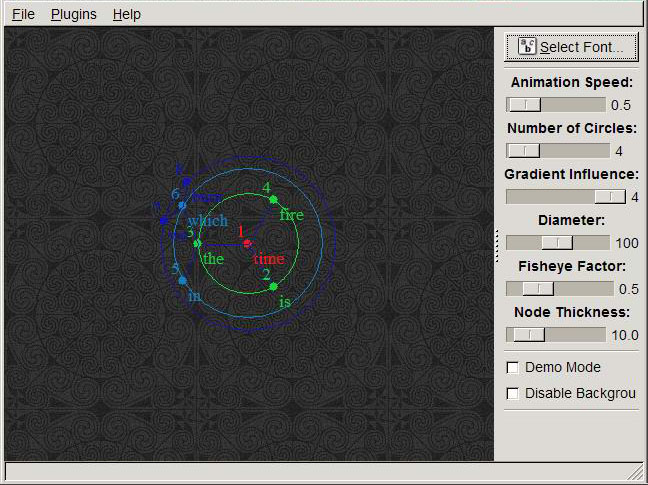
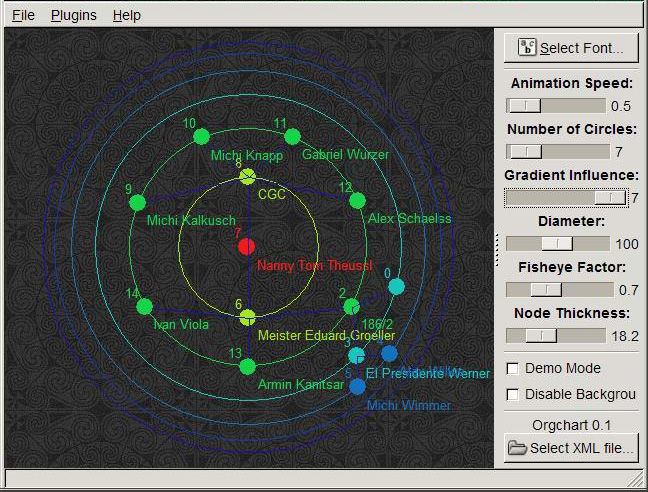
Speaking of the data, we have Nodes which are represented as dots. These
Nodes live on one of the many concentrical Circles, and are
interconneced by lines (see node_table). The creation of these Node,
Circle and node_table objects is handled by a Plugin. We will not go
into much detail here, you can assume that after loading the data via a
Plugin, the cirle_list contains some Circles, each containing a
set of Nodes which are interconnected by node_table.
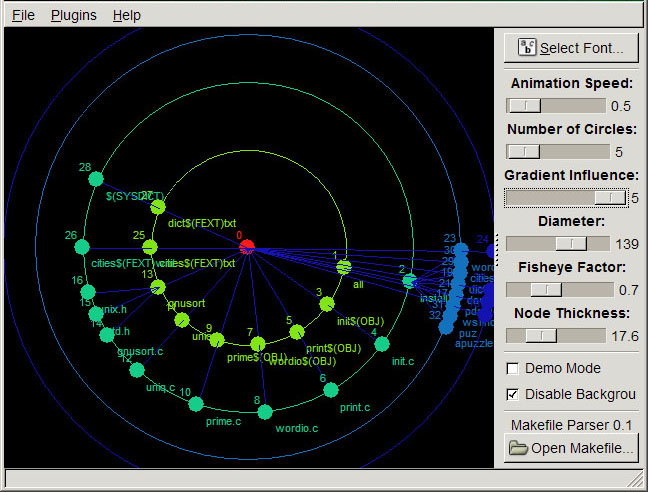
In the GUI, these Nodes, Circles and links between nodes are drawn
onto a drawing area - producing the "radar-like" look. The elements of the
user interface are specified in GLADE, a GUI designer program that outputs
XML. These XML files are parsed by pyGtk using libglade resulting in an
instantiated window containing the specified widget given back.
The Controller object handles the real work - it updates the Nodes
during animation ("reorder"). Therefore, you might want to take a look into
the recursive reorder() method and the draw() method of the GUI class for
a start -- and just get a quick sense of how this all works.
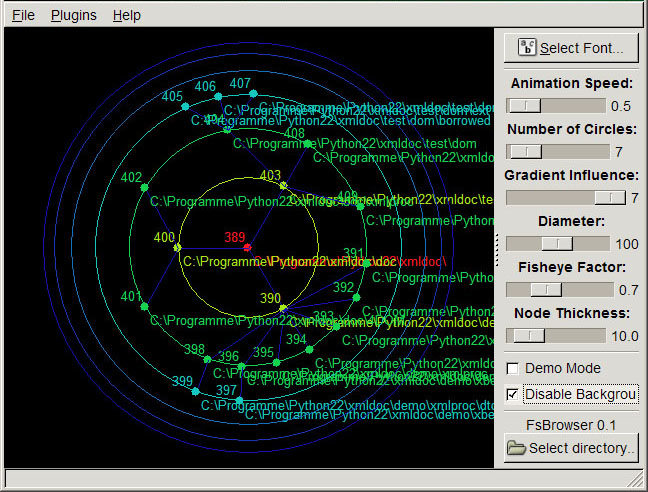
The Plugins reside in the 'plugins' directory and are parsed dynamically at
runtime. The plugin names get added into the submenu "Plugins" in the
interface. There you can select one, which brings up its GUI in the
lower-right corner of the window by calling its main entry point
init(widget, controller) in setup.py. From there one can usually select a
file containing the data that should get visualisized and start the
visualization.
By clicking at a node the node animated moves radially to the middle. By
toggling the 'Demo Mode' checkbox a random node gets continuously selected
resulting in a fluent animation (which btw. looks cool and fancy and gets
really entertaining if used with the right background music. it then also
qualifies as really cool screensaver ;)).
|