|
 | 1081-Lorenz.1.jpg |
| (image on first page of Chapt. 6) |
   |
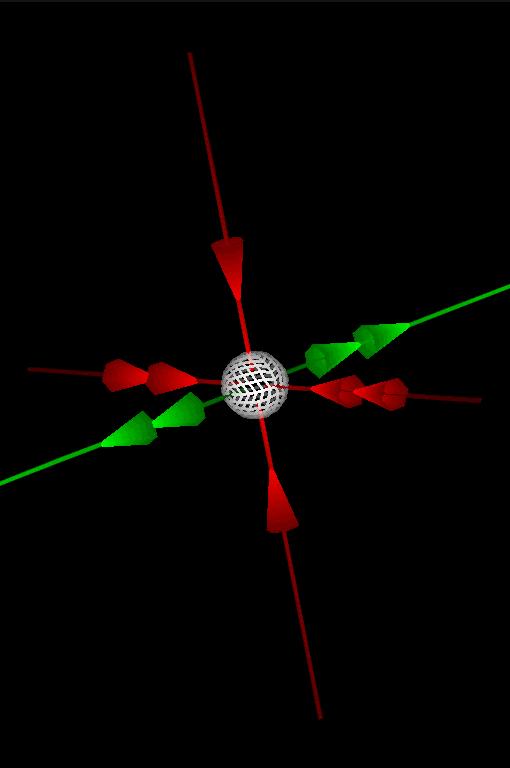
1082-RealFp.charDirs.jpg, 1083-RealFp.charDirs.2.jpg, 1084-ComplFp.charDirs.jpg |
| Figure 6.1: density and completeness of information, and amount of
quantities, provided through different approaches of
dynamical system analysis. |
  |
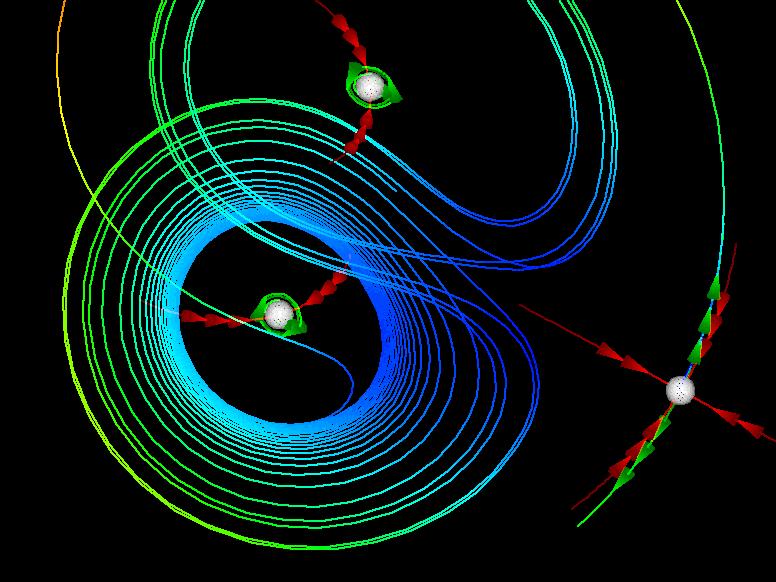
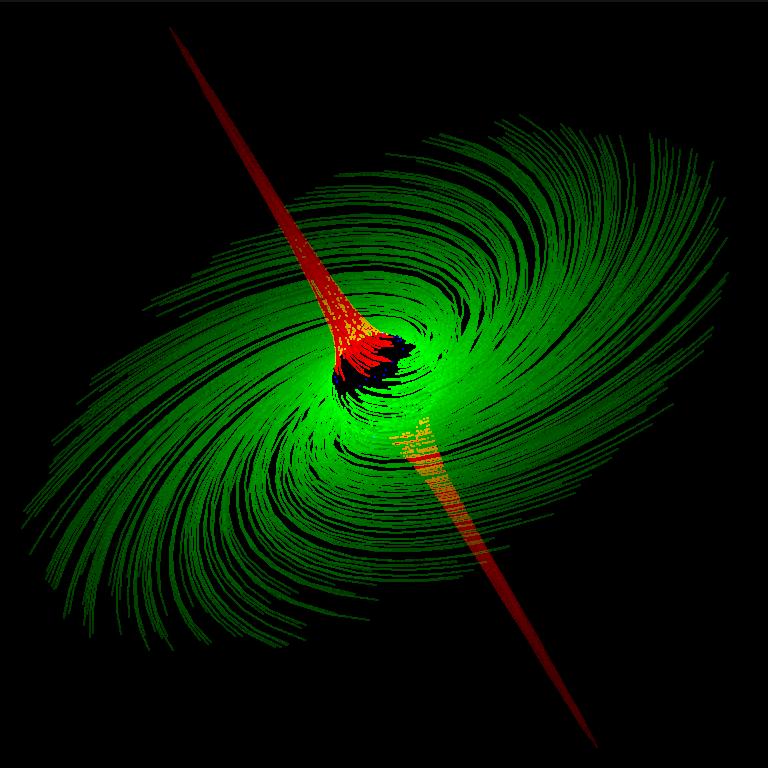
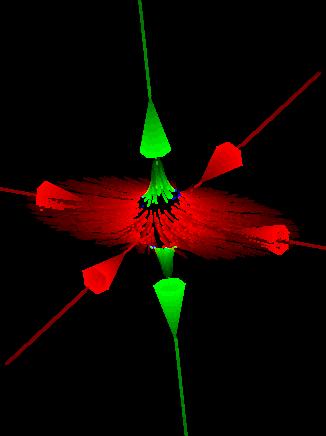
1085-Lorenz.charDirs.jpg, 1086-Lorenz.sphereTufts.jpg |
| Figure 6.2: Visualizing the flow characteristics near the critical
points of the Lorenz system:
(a) CHARDIRS and
(b) SPHERETUFTS. |
   |
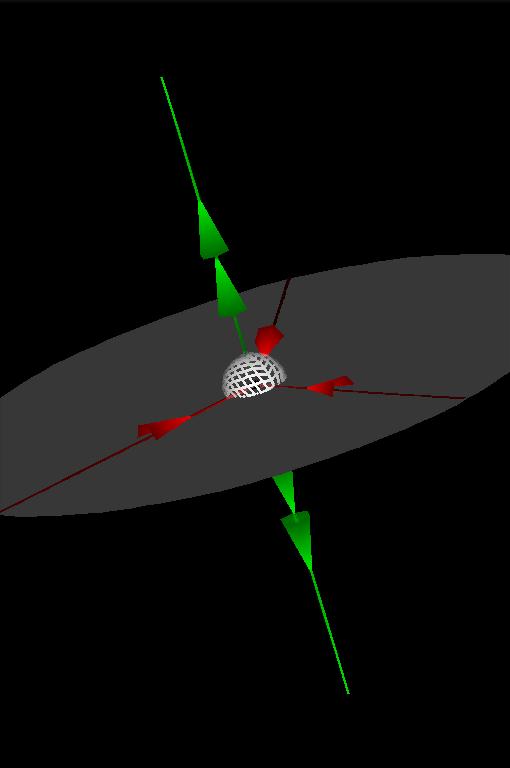
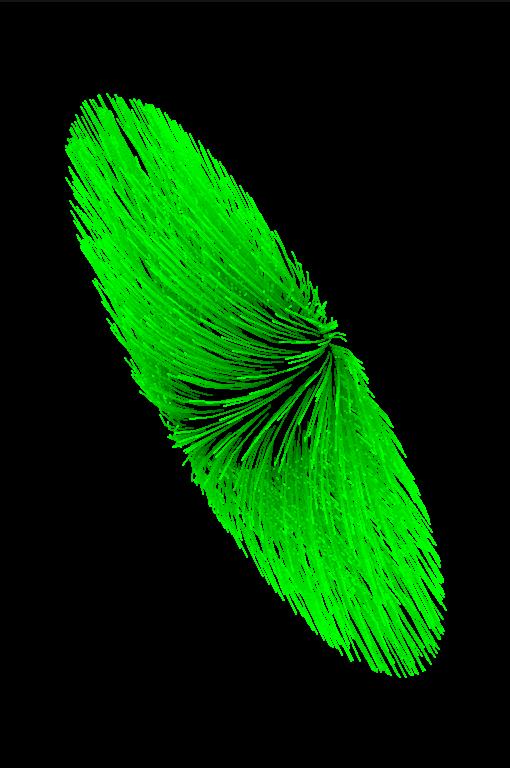
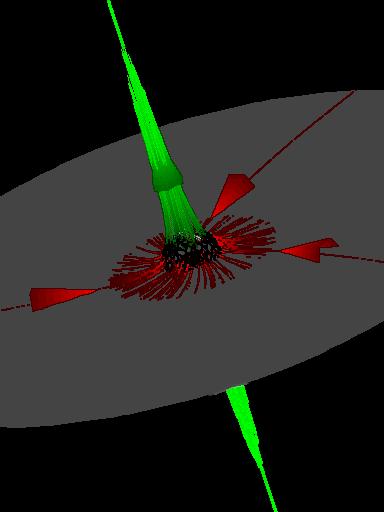
1087-ComplFp.1.jpg,
1088-ComplFp.2.jpg,
1089-Complex.2.jpg |
| Figure 6.3: Visualizing a linear system near the critical point with
a pair of conjugated complex eigenvalues:
(a) a repellor and
(b,c) two saddles. [left image] [center image] [right image] |
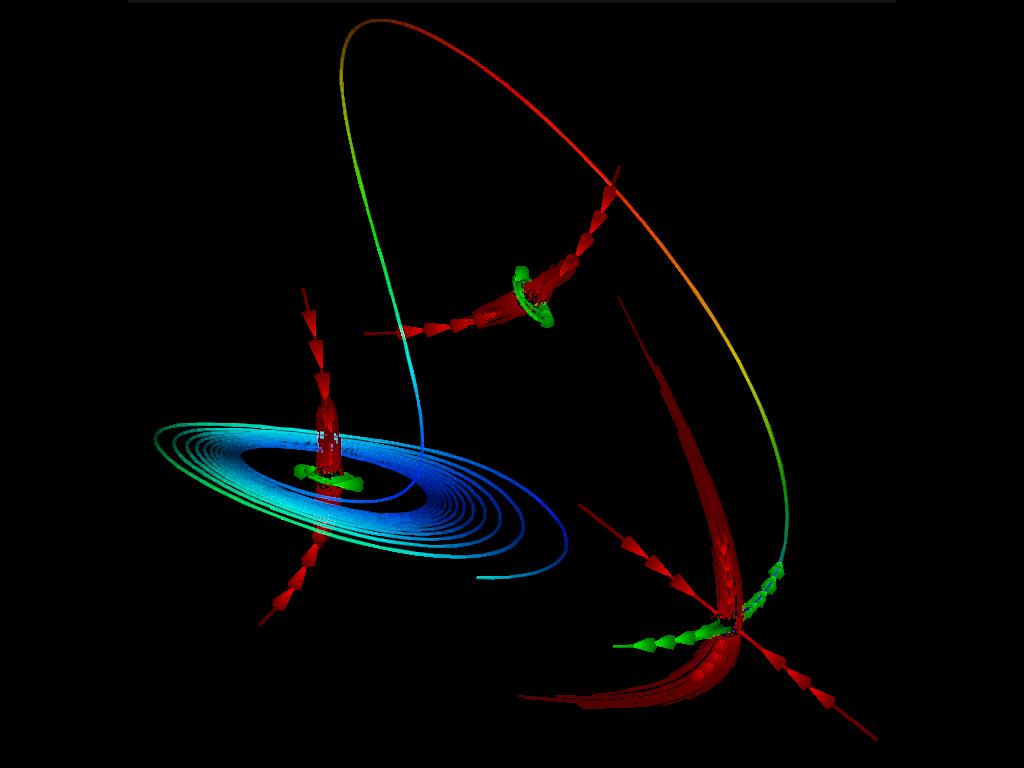
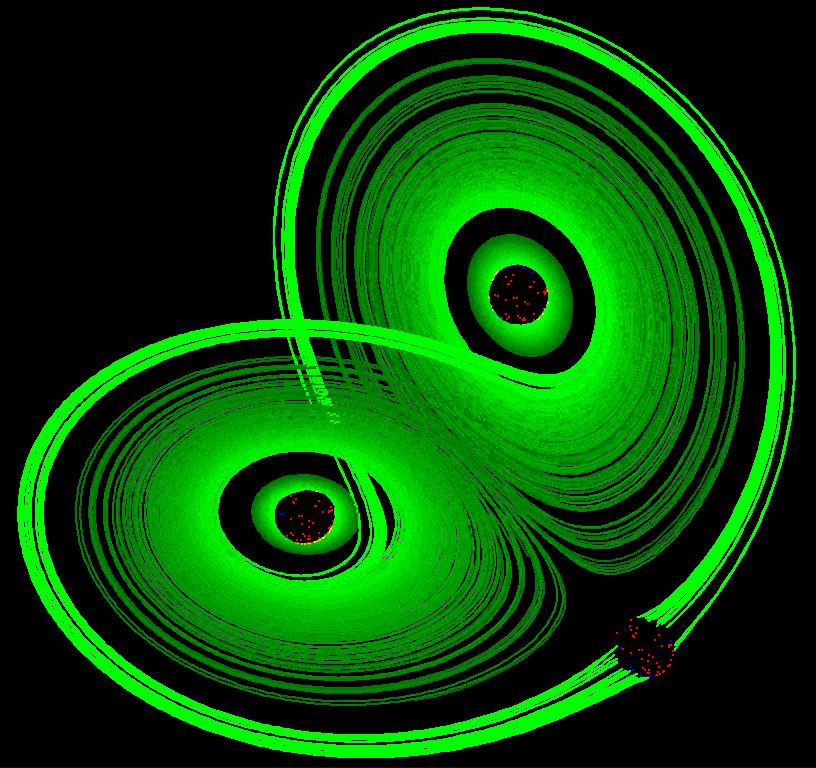
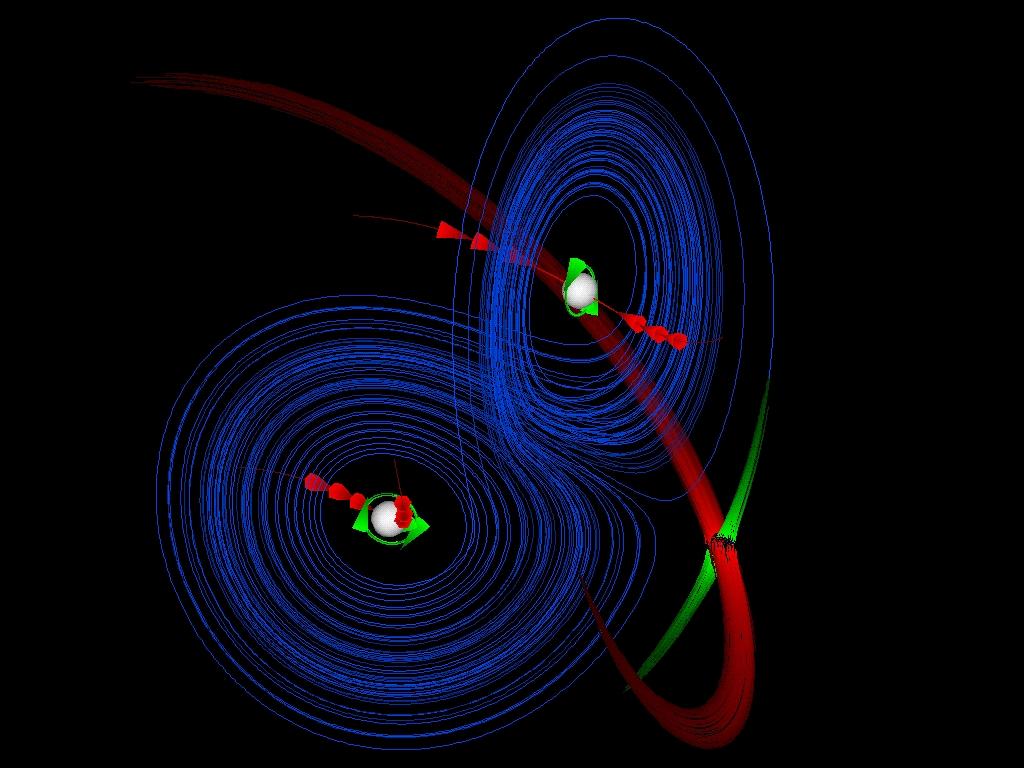
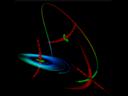
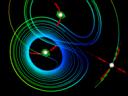
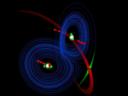 | 1090-Lorenz-old.jpg |
| Figure 6.4: Visualizing the Lorenz system using CHARDIRS and
SPHERETUFTS. |
   |
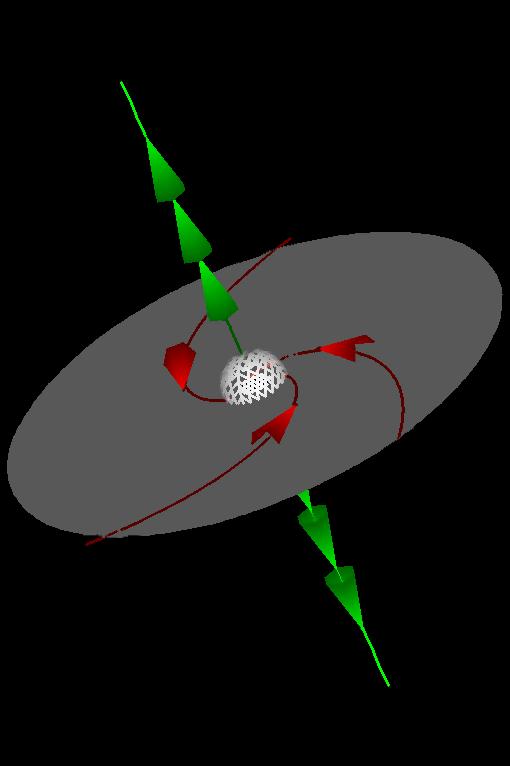
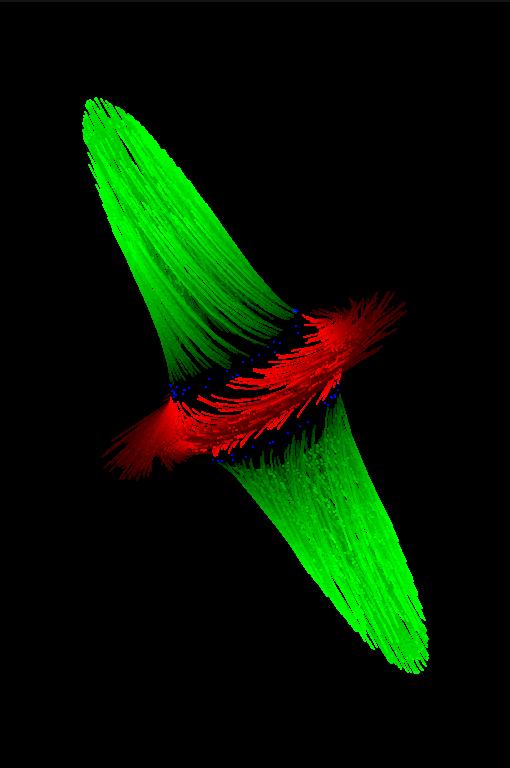
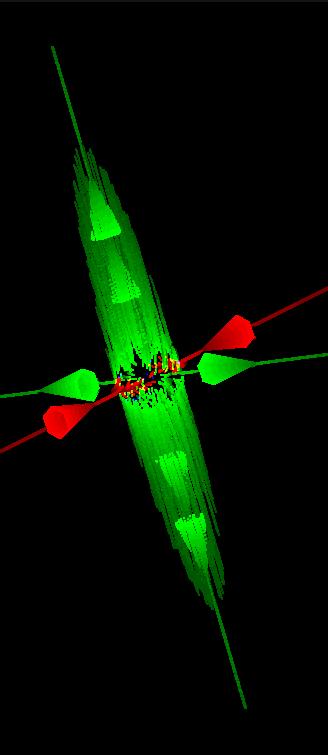
1091-ComplFp.3.jpg,
1092-RealFp.4.jpg,
1093-RealFp.Euler.3.jpg |
| Figure 6.5: Three different saddle configurations visualized using
both the eigen-manifold visualization and bunches of
streamlets. [left image] [center image] [right image] |