 (367K 728x501)
project duration: 1994-1995
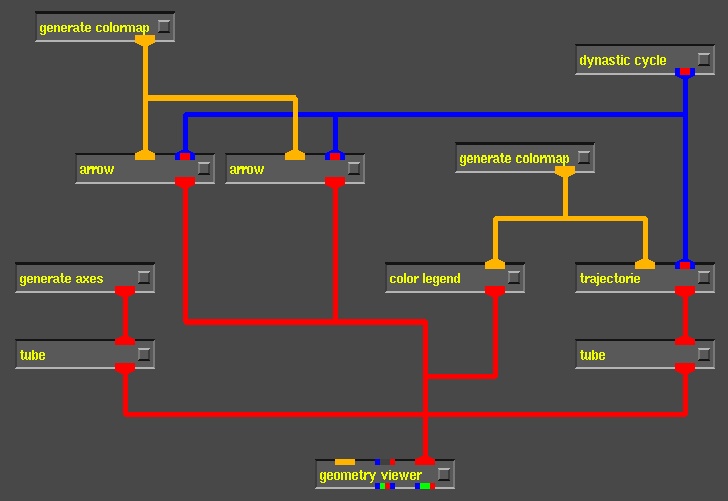
The dynastic cycle describes a three-class society of farmers (x-axis), bandits (y-axis) and rulers (z-axis). The purpose is to provide an endogenous explanation for the long term behavior of the model as a periodic alternation of the society in historic China between despotism and anarchy. The nonlinear interaction of the three classes is analyzed numerically and visualized with methods of computer graphics.
AVS (Application Visualization System) has been used to display the long term behavior of the model which is given as a three dimensional set of differential equations.
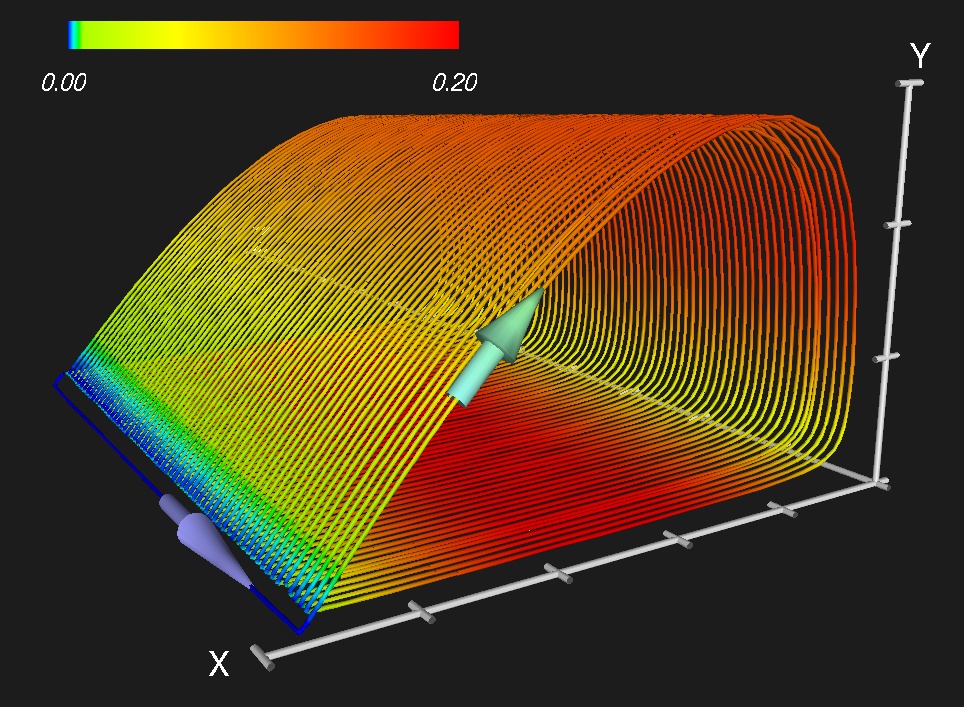
The system is characterized by a pronounced slow-fast dynamics, i.e., the x- and y-coordiantes are changing very fast as compared to the z-coordinate. The various portions of the dynastic cycle are interpreted as follows: We start at a time of maximal power of the rulers, i.e., with despotism (point 1, see following image). Since there are very few bandits, the farmers live almost undisturbed, provided they pay taxes. Then, since there is now threat by bandits, the power of the dynasty slowly decreases (slow transition from point 1 to point 2). As soon as the ruler's power falls below a certain threshold, the number of bandits suddenly increases (fast transition from point 2 to point 3). The farmers are then exploited by the bandits according to the well-known prey predator interaction. A period of anarchy starts, in which the rulers have almost no control since they are too few. However, the bandit's activities lead to a gradual increase of the rulers power. The prey-predator cycles between farmers and bandits are slowly dampened by the interacting soldiers and become a 3D converging spiral (slow transition from point 3 to point 4). As soon as the power of the rulers reaches a certain critical level they are able to eradicate bandits almost immediately (fast transition of point 4 to point 1). This can be interpreted as the rise of a new dynasty.
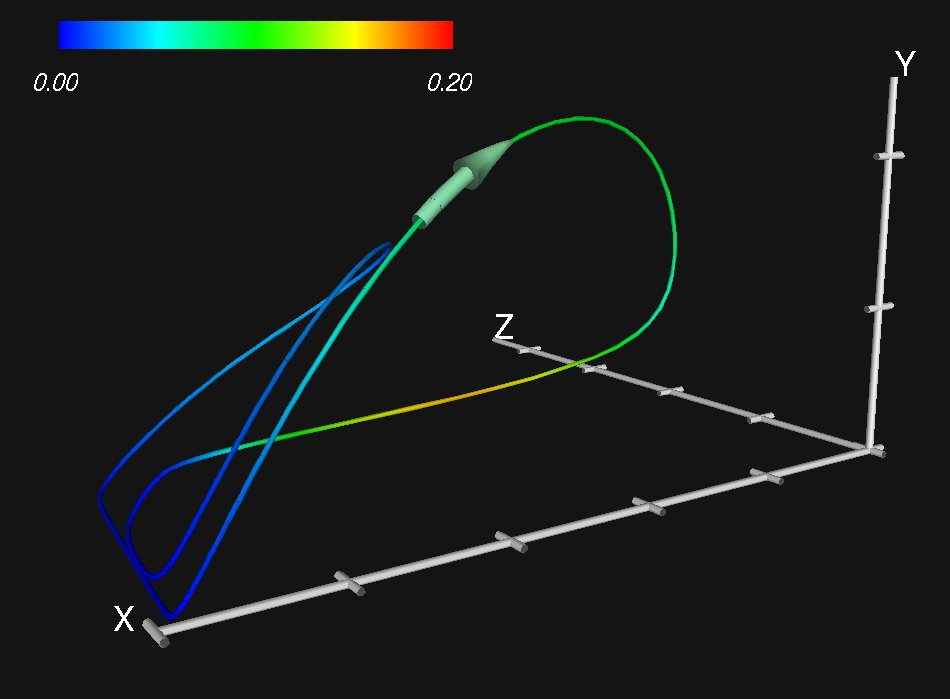
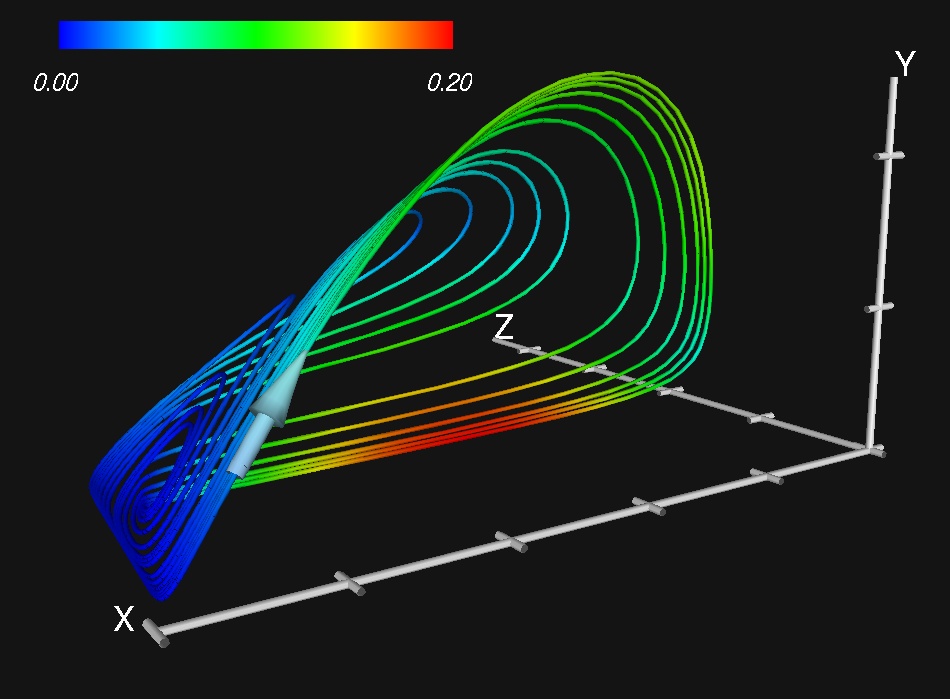
As the key parameters of the model are varied, the behavior of the system may change. The following images show different phase portraits. In particular the time paths may become very complex and chaotic, which implies that different states of the society may alternate in an unpredictable way.
 (717K 964x707)
 (92K 950x699)
 (229K 950x699)
Here we have got the above images in greyscale:

 (396K 766x707)
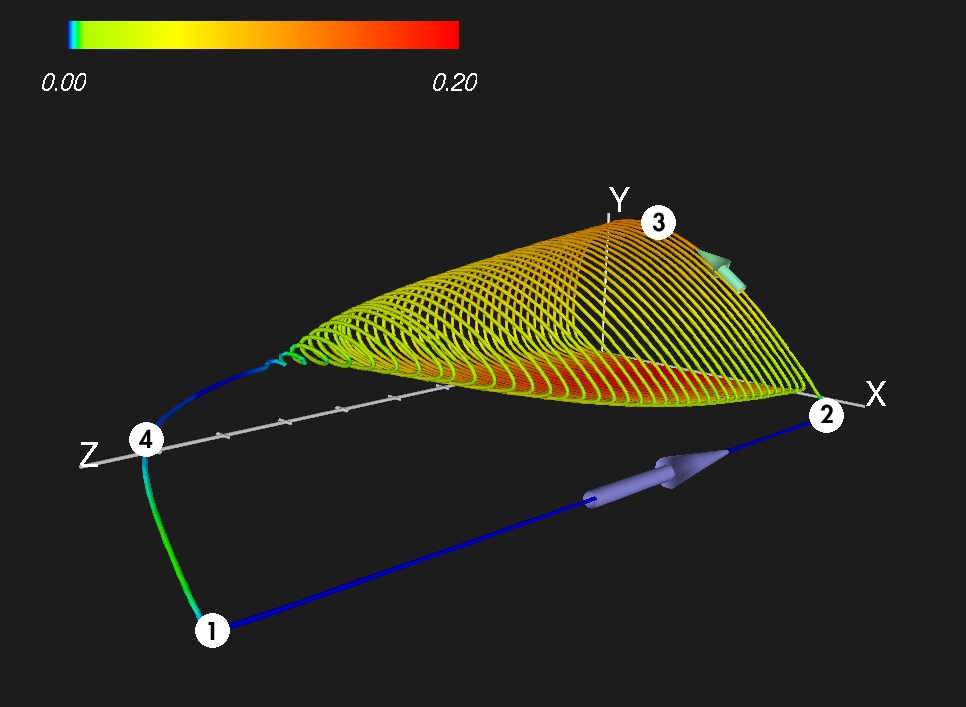 (204K 766x707)