Abstract

In general three-dimensional segmentation algorithms assume objects to have connected homogeneous regions. However in some cases objects are defined by a fuzzy boundary surface and consist of an inhomogeneous internal structure. In the following a new three-dimensional segmentation technique exploiting the contour detection capabilities of live-wire is proposed: The algorithm consists of two basic steps. First contours are outlined by the user on a small number of planar cross-sections through the object using live-wire. Second the traced contours are used for reconstructing the object surface automatically in each slice using live-wire again. This user-friendly segmentation algorithm is independent from object topology as the topology is implicitly defined during the reconstruction process.
Keywords: Segmentation, Live-wire.

Download full paper

Michael Knapp, Armin Kanitsar, Eduard Gröller, "Semi-Automatic Topology Independent Contour-Based 2 1/2 D Segmentation Using Live-Wire", in Proceedings of WSCG'2004, contoursegwscg.pdf (6MB).

Figures in the paper

Figure 1:

The user traces the object boundary of the tooth dataset in each orthogonal cross-section. The connectivity points are depicted by black dots.
Figure 2:

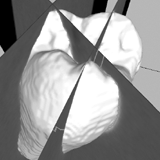
Three-dimensional display of the cross-sections with outlines (left), with the reconstructed surface (middle) and the reconstructed surface (right).
Figure 3:

Outlines of two cross-sections may have points in common. These connectivity points are on the intersection line of two cross-sections.
Figure 4:

The slice is split into a number of convex polygons by intersecting cross-sections (left) and its connectivity graph (right). Letters indicate polygons and numbers indicate outline points.
Figure 5:

This figure shows a case where an invalid intersection occurs. Thick lines mean inside. Left: Two intersecting cross-sections, where an inside line fragment intersects an outside fragment. Right: The connectivity graph of this case.
Figure 6:

According to Figure 5 two different modifications are possible, depending on the outline point closer to the intersection point. This modification turns an invalid case into a valid case. Left: Point 1 closer to the invalid intersection point. Right: Point 2 closer to the intersection point.
Figure 7:

This figure shows the possible succeeding edges indicated by arrows pointing away from W.
Figure 8:

The flow chart of the segmentation process described in section 3 (left side) and 4 (right side).
Figure 9:

Segmented right leg bones seen from the back applying thresholding at 386 Hu (top), region growing (middle), the new method (bottom).
Figure 10:

Figure 9: Coronal MIP of a CTA dataset. The mask for removing the bones was generated by thresholding (top), region growing (middle), the new method (bottom).

Additional Material

BibTeX Entry

@InProceedings{Knapp:2003:SAT,
  author = {Michael Knapp and Armin Karnitsar and Eduard Gr\"oller},
  title = {Semi-Automatic Topology Independent Contour-Based 2 1/2 D Segmentation Using Live-Wire},
  booktitle = {Proceedings of WSCG},
  year = {2004},
  pages  = {???--???},
}