

Artem Amirkhanov, Bernhard Fröhler, Johann Kastner, Eduard Gröller , Christoph Heinzl
InSpectr: Multi-Modal Exploration, Visualization, and Analysis of Spectral Data
Computer Graphics Forum, 33(3):91-100, June 2014. [ _fast forward] [
![]() slides] [
slides] [ video]
Information
- Publication Type: Journal Paper with Conference Talk
- Workgroup(s)/Project(s):
- Date: June 2014
- Journal: Computer Graphics Forum
- Volume: 33
- Number: 3
- Note: Article first published online: 12 JUL 2014
- Location: Swansea, UK
- Lecturer: Bernhard Fröhler
- Event: Euro Vis 2014
- Conference date: 9. June 2014 – 13. June 2014
- Pages: 91 – 100
- Keywords: multi-modal data, XRF, industrial computed tomography, linked views, spectral data
Abstract
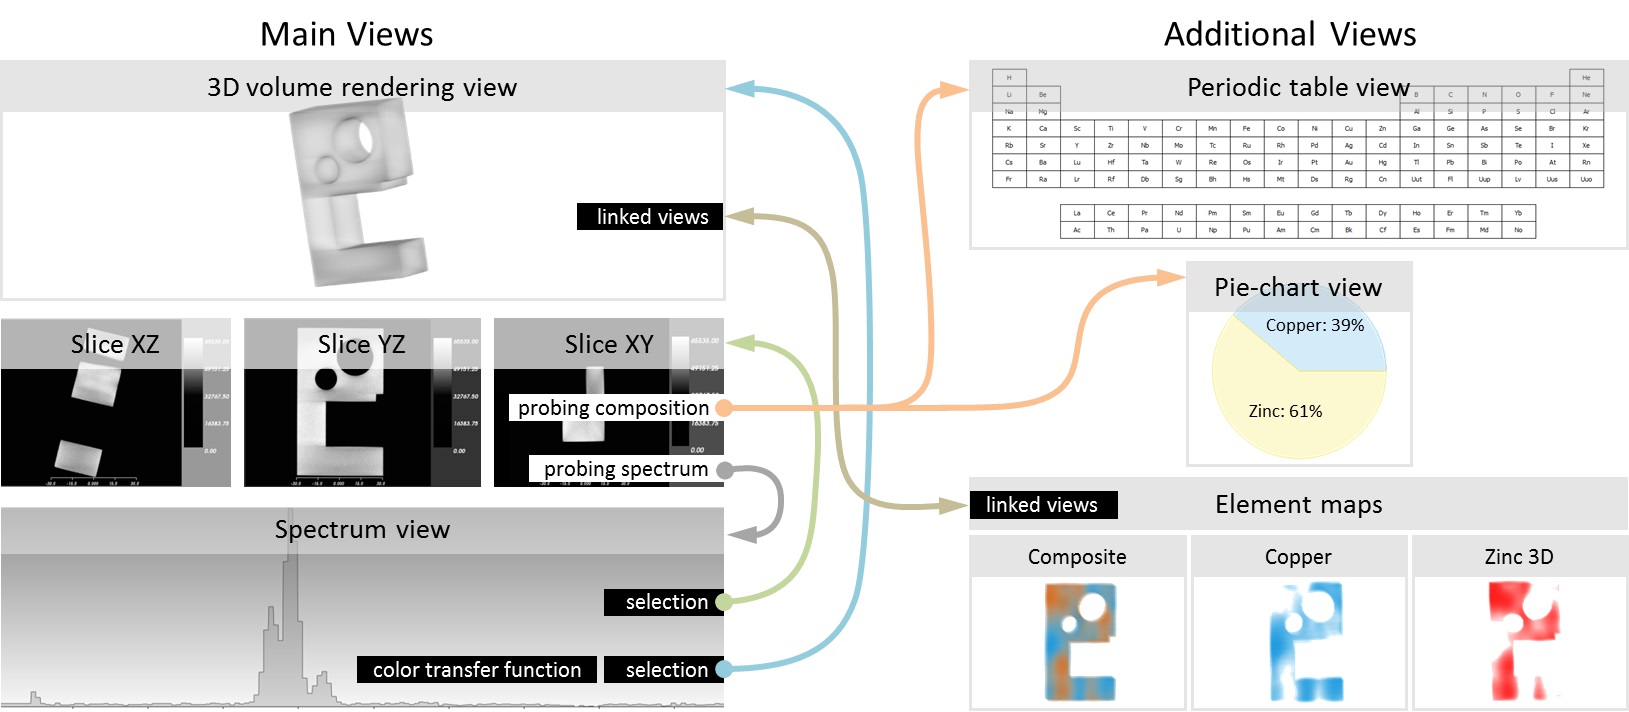
This paper addresses the increasing demand in industry for methods to analyze and visualize multimodal data involving a spectral modality. Two data modalities are used: high-resolution X-ray computed tomography (XCT) for structural characterization and low-resolution X-ray fluorescence (XRF) spectral data for elemental decomposition. We present InSpectr, an integrated tool for the interactive exploration and visual analysis of multimodal, multiscalar data. The tool has been designed around a set of tasks identified by domain experts in the fields of XCT and XRF. It supports registered single scalar and spectral datasets optionally coupled with element maps and reference spectra. InSpectr is instantiating various linked views for the integration of spatial and non-spatial information to provide insight into an industrial component’s structural and material composition: views with volume renderings of composite and individual 3D element maps visualize global material composition; transfer functions defined directly on the spectral data and overlaid pie-chart glyphs show elemental composition in 2D slice-views; a representative aggregated spectrum and spectra density histograms are introduced to provide a global overview in the spectral view. Spectral magic lenses, spectrum probing and elemental composition probing of points using a pie-chart view and a periodic table view aid the local material composition analysis. Two datasets are investigated to outline the usefulness of the presented techniques: a 3D virtually created phantom with a brass metal alloy and a real-world 2D water phantom with insertions of gold, barium, and gadolinium. Additionally a detailed user evaluation of the results is provided.Additional Files and Images

Weblinks
BibTeX
@article{amirkhanov-2014-ama,
  title =      "InSpectr: Multi-Modal Exploration, Visualization, and
               Analysis of Spectral Data",
  author =     "Artem Amirkhanov and Bernhard Fr\"{o}hler and Johann Kastner
               and Eduard Gr\"{o}ller and Christoph Heinzl",
  year =       "2014",
  abstract =   "This paper addresses the increasing demand in industry for
               methods to analyze and visualize multimodal data involving a
               spectral modality. Two data modalities are used:
               high-resolution X-ray computed tomography (XCT) for
               structural characterization and low-resolution X-ray
               fluorescence (XRF) spectral data for elemental
               decomposition. We present InSpectr, an integrated tool for
               the interactive exploration and visual analysis of
               multimodal, multiscalar data. The tool has been designed
               around a set of tasks identified by domain experts in the
               fields of XCT and XRF. It supports registered single scalar
               and spectral datasets optionally coupled with element maps
               and reference spectra. InSpectr is instantiating various
               linked views for the integration of spatial and non-spatial
               information to provide insight into an industrial
               component’s structural and material composition: views
               with volume renderings of composite and individual 3D
               element maps visualize global material composition; transfer
               functions defined directly on the spectral data and overlaid
               pie-chart glyphs show elemental composition in 2D
               slice-views; a representative aggregated spectrum and
               spectra density histograms are introduced to provide a
               global overview in the spectral view. Spectral magic lenses,
               spectrum probing and elemental composition probing of points
               using a pie-chart view and a periodic table view aid the
               local material composition analysis. Two datasets are
               investigated to outline the usefulness of the presented
               techniques: a 3D virtually created phantom with a brass
               metal alloy and a real-world 2D water phantom with
               insertions of gold, barium, and gadolinium. Additionally a
               detailed user evaluation of the results is provided.",
  month =      jun,
  journal =    "Computer Graphics Forum",
  volume =     "33",
  number =     "3",
  note =       "Article first published online: 12 JUL 2014",
  pages =      "91--100",
  keywords =   "multi-modal data, XRF, industrial computed tomography,
               linked views, spectral data",
  URL =        "https://www.cg.tuwien.ac.at/research/publications/2014/amirkhanov-2014-ama/",
}