Flow Visualization, LU
Visualisierung WS 2006
Martin Knecht, 0326294, martin.knecht#aon.at
Michael Schwärzler, 0325222, michael#schwaerzler.com
|
Download
FlowVisualization06.zip (1,3
MB)
|
Flow Visualization 2006
"FlowVisualization 2006" was developed in the winter semester
2006 for the LU "Visualisierung" at the Technical University of Vienna. It is a
software designed to visualize flow data (weather data, wind tunnel data,
etc.).
Technical details: The software was developed in C++/DirectX9. A lot of
calculation is done on the GPU using Shaders, so you will need a GPU which
supports at least Shader Model 3.
The program uses the flow data to generate three different layers which can be
switched on an off: A background texture which maps the data into a texture, an
arrow plot, and streamlines.
Background:
-
Can be switched on/off
-
Choose a data set feature (for example, velocity) to generate a background
image.
-
The whole data set is sampled in order to get an interpolated feature value for
each pixel.
-
The grey value image can be colored using the color selector.
Arrow Plot:
-
Can be switched on/off
-
Arrows are used to display the flow velocity at regular sample points.
-
The data set features can be used to color the arrows.
-
The data set features can also be used to modify the arrow size.
-
The grey value arrows can be colored using the color selector.
Streamlines:
-
Can be switched on/off
-
Streamlines are used to display the flow.
-
Two calculation methods are implemented: Euler and Runge-Kutta integration.
-
Choose between automatically evenly spaced stream lines and manually seeded
stream lines.
-
The integration step size as well as DSep and DTest can be changed.
-
Advanced Methods: Use Glyphs, Tapering and Textures to improve the stream line
visualization quality.
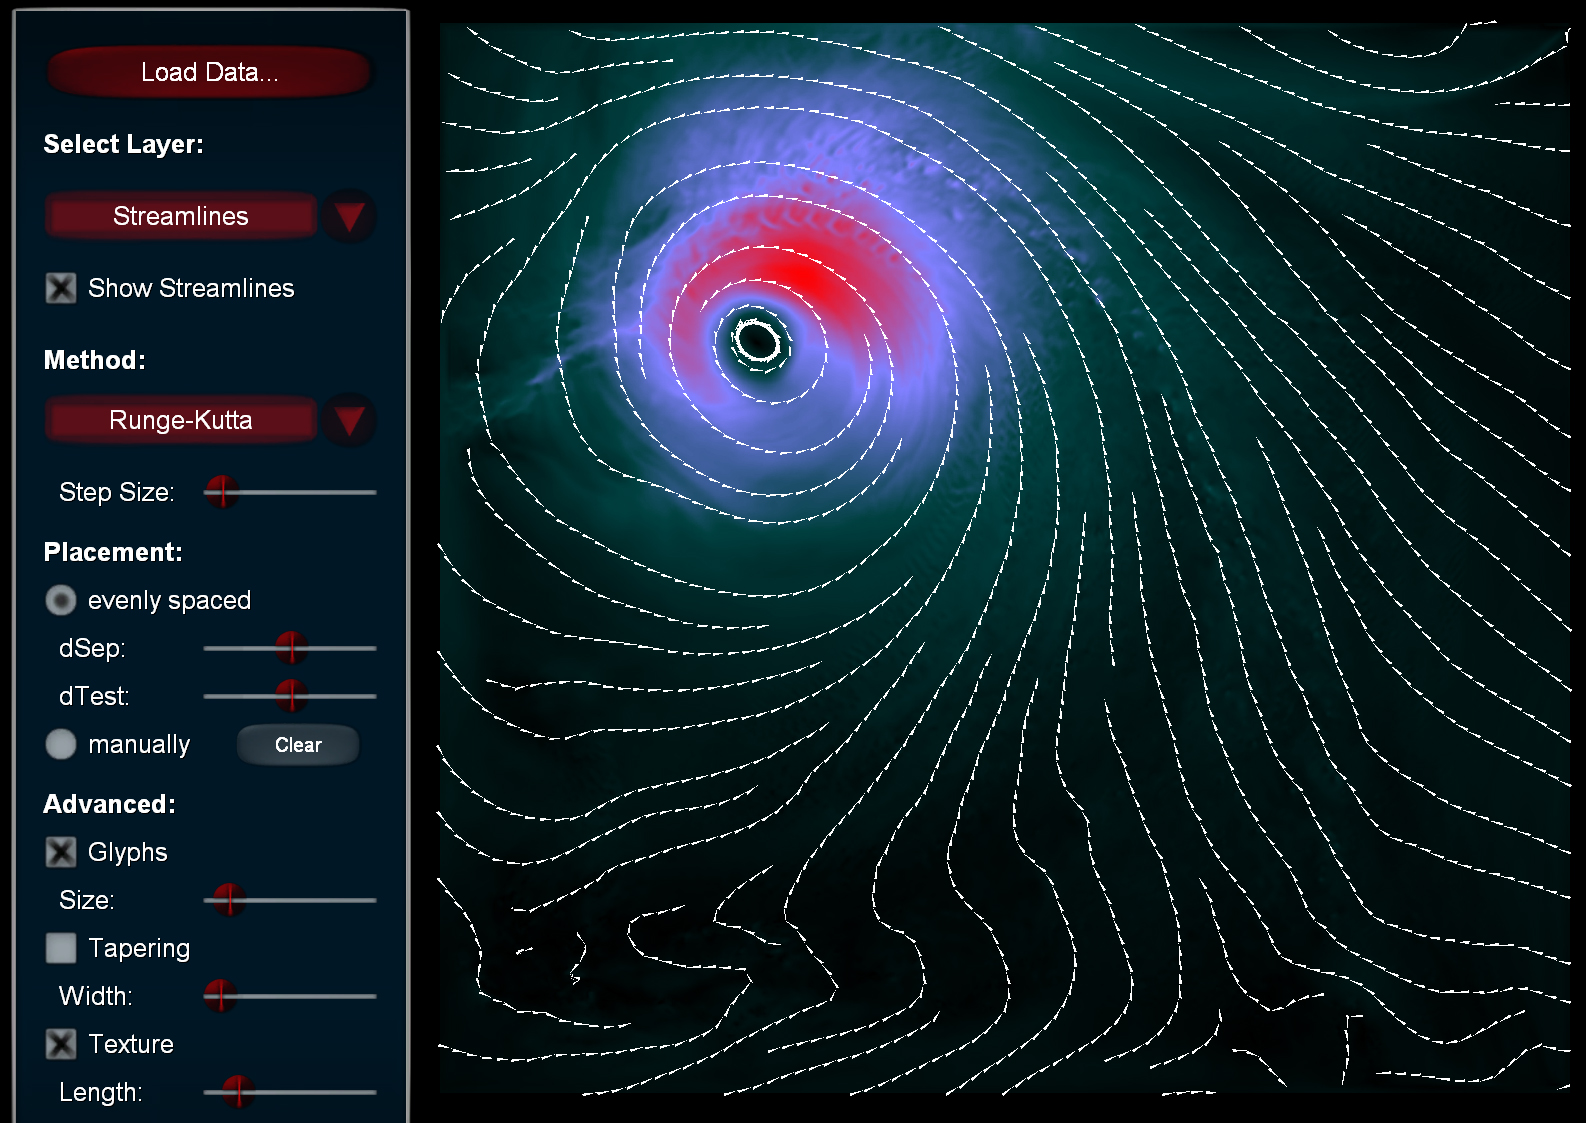
Using the program
Once the program starts, you will see this screen:
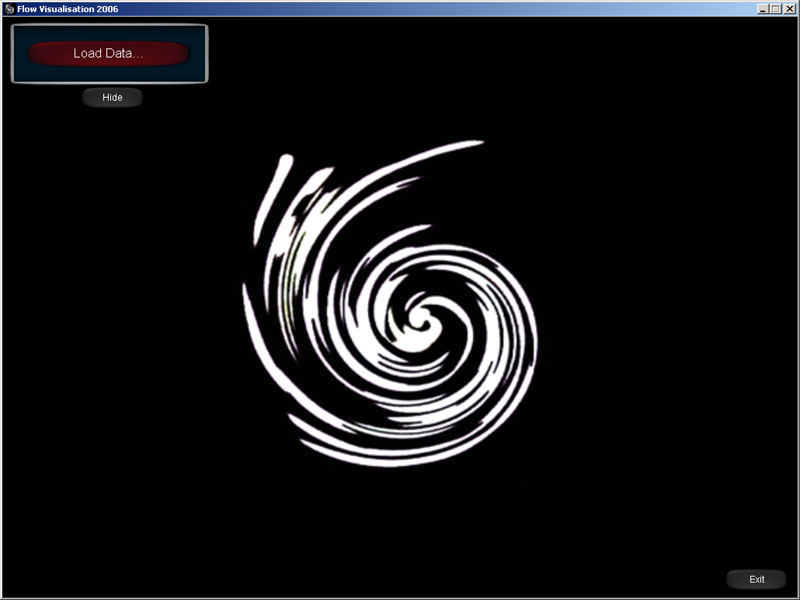
Click the "Load Data" button to load a new data set.
NOTE: You can exit the program anytime by clicking the "Exit" button on the
lower right.
NOTE: All windows on the screen can be hidden, so that the rendered results can
be watched without any disturbing GUI control. Just click the "Hide" buttons to
make them disappear. In order to make them visible again, click the
corresponding "Show" buttons.
NOTE: Zoom by pressing and dragging the right mouse button. Move the
visualization by pressing and dragging the left mouse button.
Background:
Once you have loaded a new data set, the program will automatically activate
the background layer:
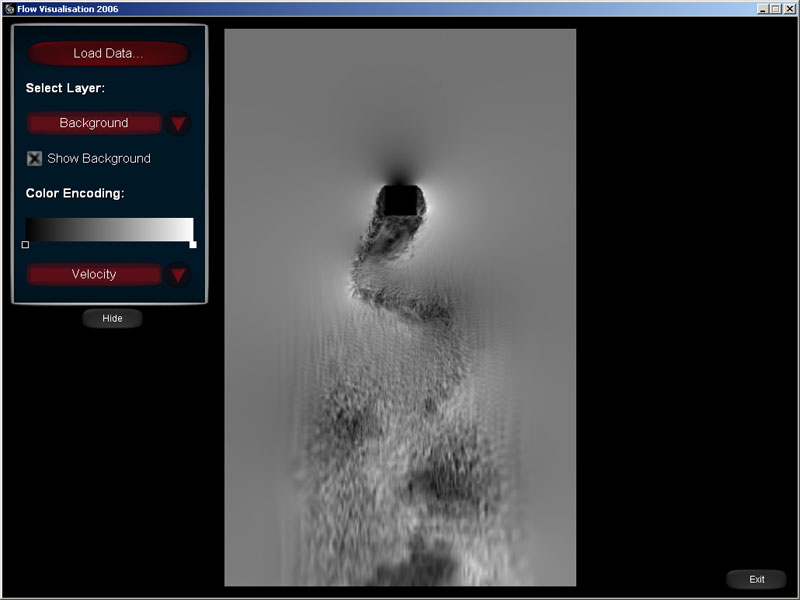
-
Select Layer: Choose between background,
arrow and streamline layer.
-
Show Background: Turn this layer on/off.
-
Color Selection: The lower the feature value at a specific
pixel, the darker the pixel. You can change this color range by modifying the
color bar: Left-click to add/move control points. Right-click on the control
points to change their color or delete them.
-
Choose the feature which is used to generate the background by changing the the
value in the color encoding combo box.
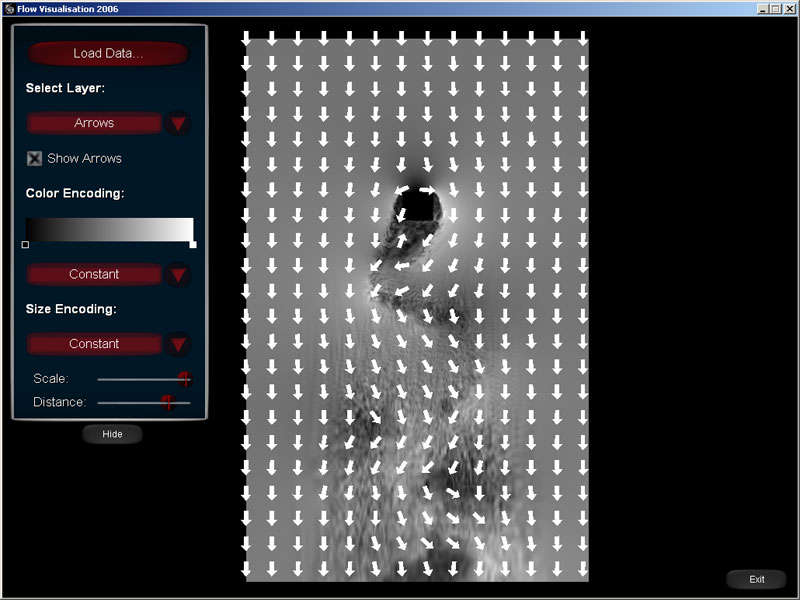
Arrows:
If you choose Arrows in the layer selection combo box, the interface will
change:
-
Select Layer: Choose between background,
arrow and streamline layer.
-
Show Arrows: Turn this layer on/off.
-
Color Selection: The lower the feature value at a arrow sample
point, the darker the arrow. You can change this color range by modifying the
color bar: Left-click to add/move control points. Right-click on the control
points to change their color or delete them. Note: You have to change the color
encoding combo box to something different than "Constant".
-
Choose the feature which is used to color the arrows by changing the the value
in the color encoding combo box. if you choose "constant", the arrows will be
white.
-
Choose the feature which is used to scale the arrows by changing the the value
in the size encoding combo box. if you choose "constant", all arrows will be
the same size.
-
Scale & Distance sliders: Change the general size and distance of the
arrows.
Streamlines:
By choosing Streamlines in the layer selection combo box, the interface is
changed once again:

-
Select Layer: Choose between background,
arrow and streamline layer.
-
Show Streamlines: Turn this layer on/off.
-
Method: Choose the numerical integration method used to
calculate the stream lines. Euler is faster, but Runge-Kutta is a lot more
precise. Use the step size slider to change the integration step size.
-
Placement: Choose between evenly spaced stream lines and maually seeded stream
lines. You can change the parameters of the evenly spaced stream lines by
moving the accordind sliders. If you are in manual mode. click somewhere on the
image to seed a new stream line. Press the clear button to remove all manually
seeded stream lines.
-
Advanced: Activate advanced visualization methods such as glyphs, tapering and
textures by clicking the according check boxes. Use the sliders to change their
appearance.
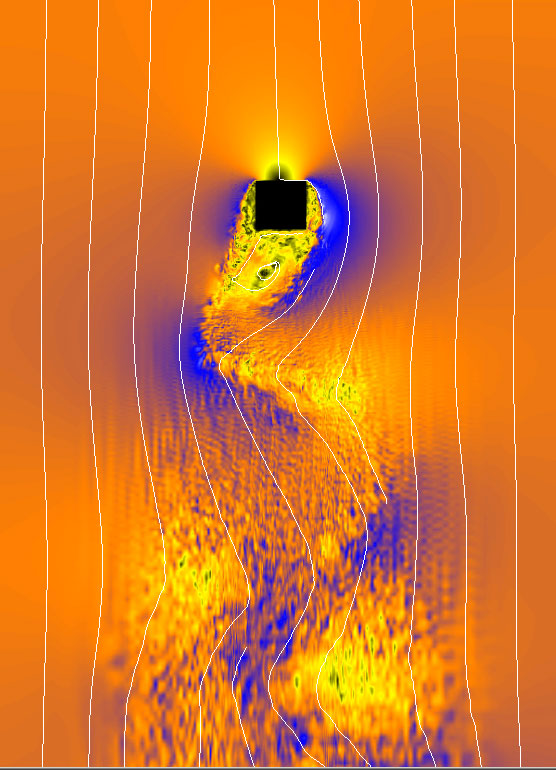
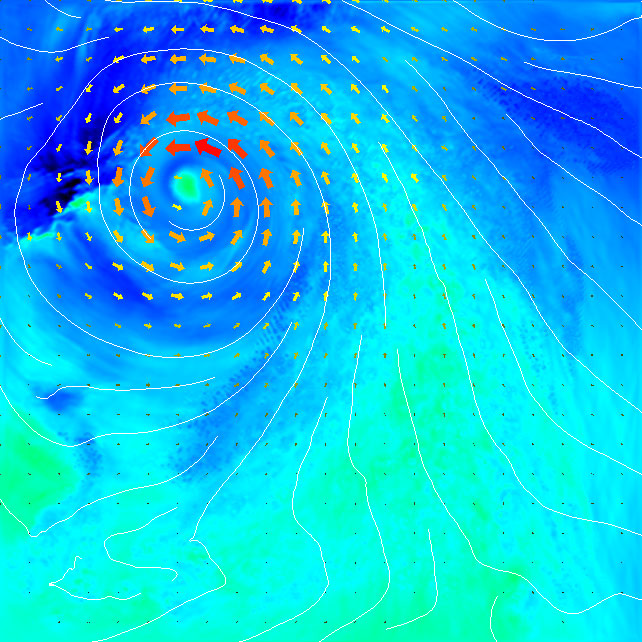
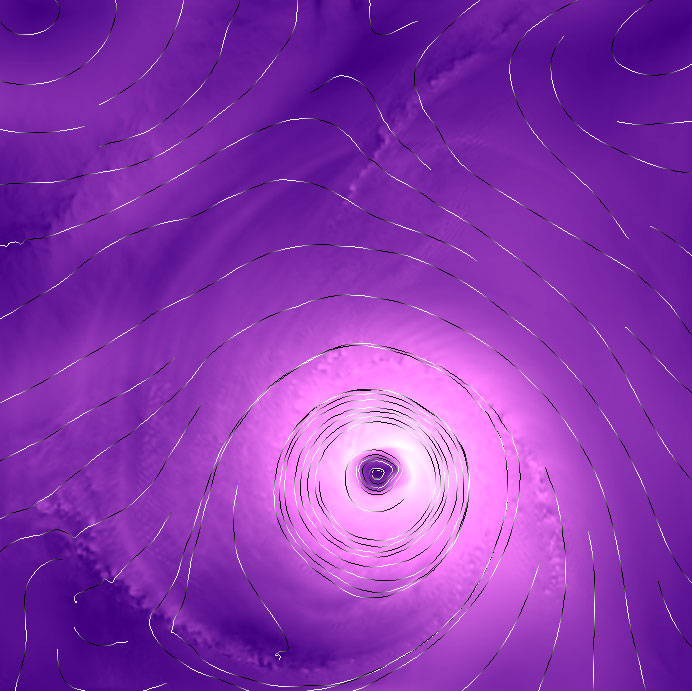
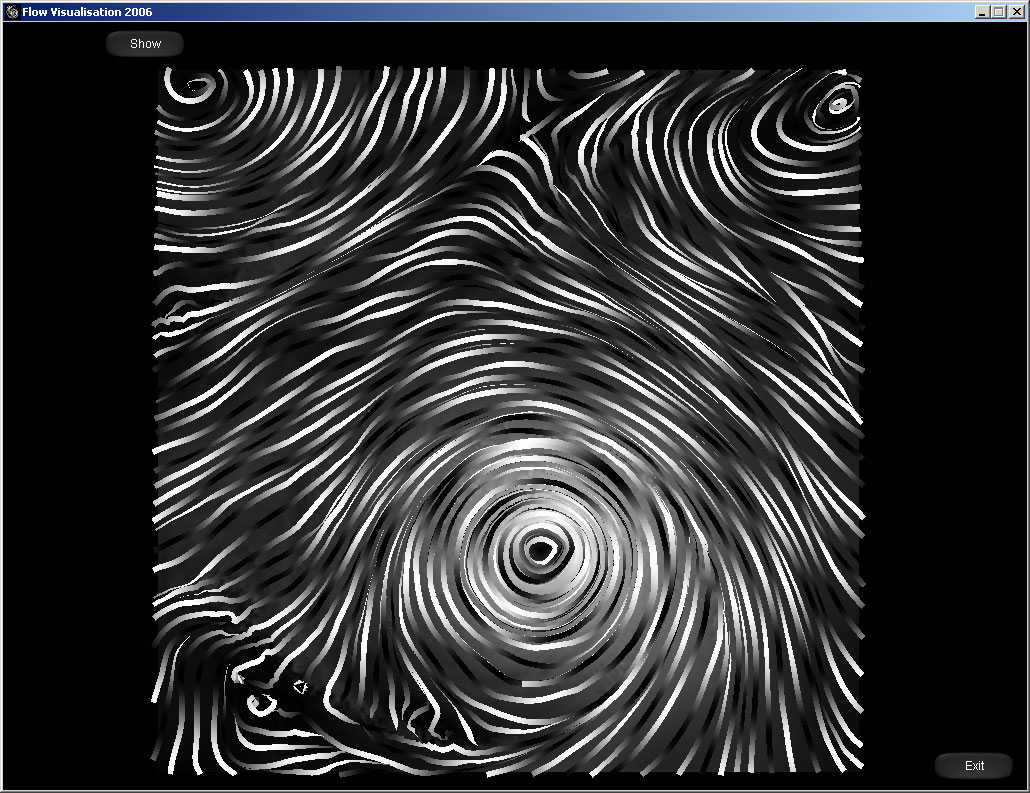
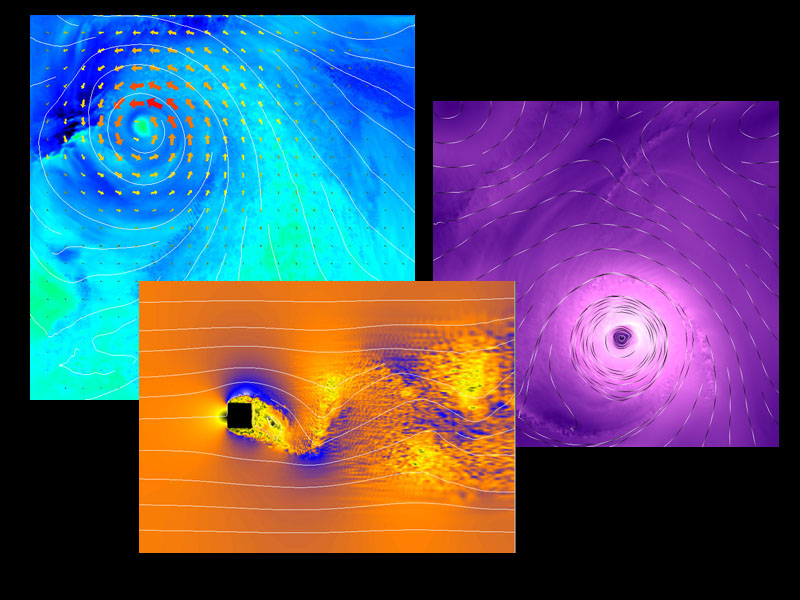
Gallery:
Some cool renderings we captured: