Bilal Alsallakh 2007
Matrikel#: 0627567, email: bilal.sal [ a t ] gmail.com
InfoVis, SS07
Vienna University of Technology
Based on:
Danny Holten: "Hierarchical Edge Bundles, Visualization of Adjacency Relations in Hierarchical Data", IEEE Trans. on Visualization and Computer Graphics, Vol. 12, No. 5 2006
The purpose of this work is to introduce the edge bundling technique for visualizing adjacency relations in hierarchical data.
Hierarchies are very popular models for relations between items. Adjacency relations are frequently defined between the items to enrich the model, allowing modeling interactions between the different items in the hierarchy. For example the hierarchical relations can represent the administrative subdivisions of an organization, and the adjacency relations can represent the dependency between these subdivisions.
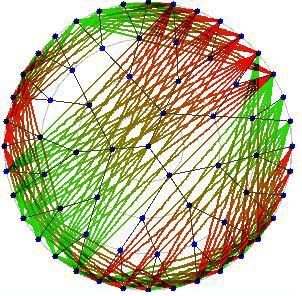
Simply visualizing the adjacency relations as straight lines leads to a cluttered visualization as explained in Fig 1.
Fig 1. Visualizing links as straight lines
The suggested technique, tries to bundle edges whose end points have tree paths that share a common part. It is similar to the bundling performed by electricians for wiring in complex settings, where wires having roughly close sources and targets are bundled together to reduce the mess, in our case, the visual clutter caused.
In terms of computer graphics, the bundling effect is achieved by visualizing a link between two tree nodes as a uniform cubic B-Spline curve which control polygon is the path along the tree between the two nodes, excluding their common ancestor. This technique is explained in Fig. 2.
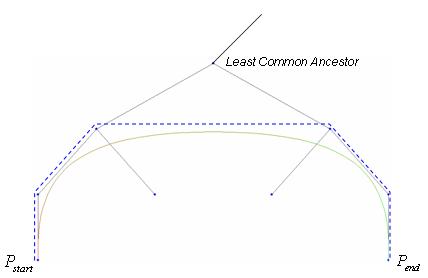
Fig 2. Visualizing a link using a uniform cubic B-Spline
This technique is general and can be basically applied to all standard tree visualization methods. Fig 3. shows the result of applying bundling to the data in Fig. 1.
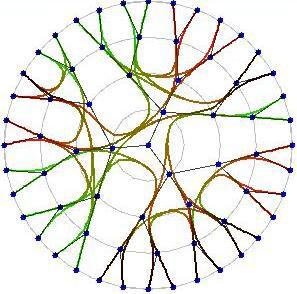
Fig 3. Visualizing the data using B-Spline links
To reduce the ambiguity caused by this bundling, the bundling degree is relaxed between 0 (no bundling) and 1 (full bundling), using a linear interpolation between the direct line connecting the two nodes, and the tree path, as explained in Fig .4.
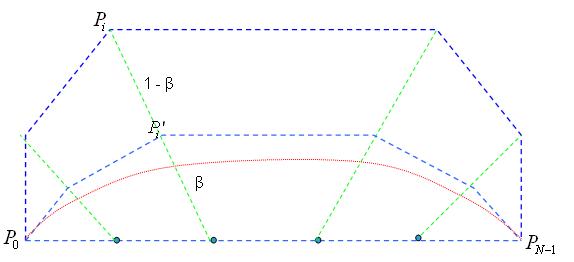
Fig 4. Controlling the degree of Bundling by means of linear interpolation.
Here is an example of the same data bundled with a bundling degree of 45%
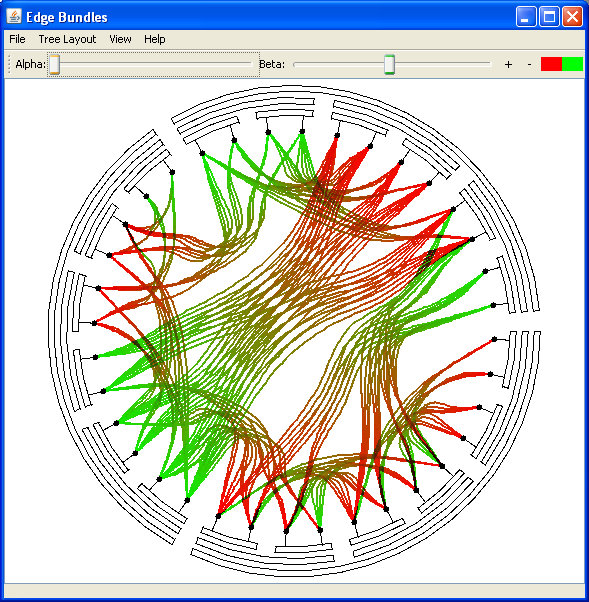
Fig 5. Partial Bundling: compromise between no and full bundling
To prevent longer curves from dominating shorter ones and, the latter ones should be displayed above the former ones and the longer curves should receive fewer intensity, giving higher visibility to the shorter curves. This is achieved by means of alpha blending, which helps reducing the clutter and creating more plausible visualization. For more details, one can review the original work paper. The degree of this blending can be controlled by the user. To prevent complete occlusion in case of overlapping bundles, the minimum composition rule is used to generate the output in the overlapping areas, allowing both colors to contribute in the output, and giving the feedback that both bundles are present (this can be easily seen in Fig. 5).
Here is an result of using high alpha blending (notice how longer curves are blended while shorter ones receive higher intensity).
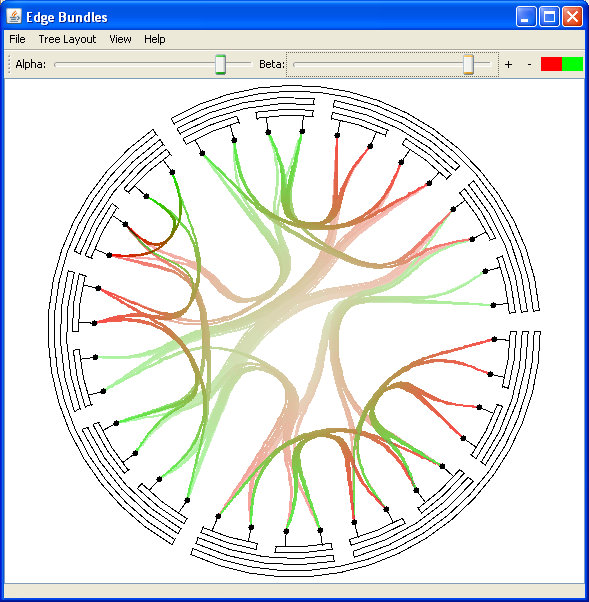
Fig 6. Alpha Blending: longer curves receive lower intensity.
The implementation enables the user to:
load a dataset file
selecting one of many available tree visualization layouts, viz.:
Radial Layout
Inverted Radial Layout
new RootedLayout
InvertedRootedLayout
Balloon Layout
TreeMap Layout
Random Layout
selecting the bundling degree (beta parameter)
selecting the alpha blending degree (alpha parameter)
selecting the source and destination colors
Panning and zooming in the drawing panel
Here is a gallery of screenshots of my implementation of this algorithm.
Fig 7. using the inverted radial layout, with high bundling and blending degrees
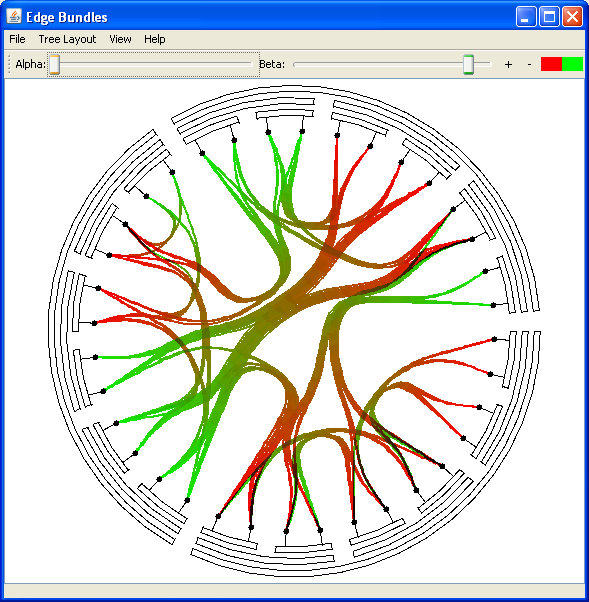
Fig 8. using the inverted radial layout, with high bundling and low blending degrees
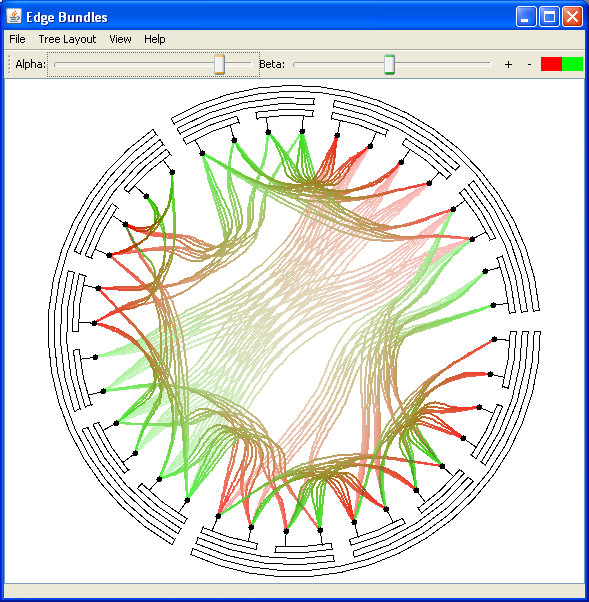
Fig 9. using the inverted radial layout, with low bundling and high blending degrees
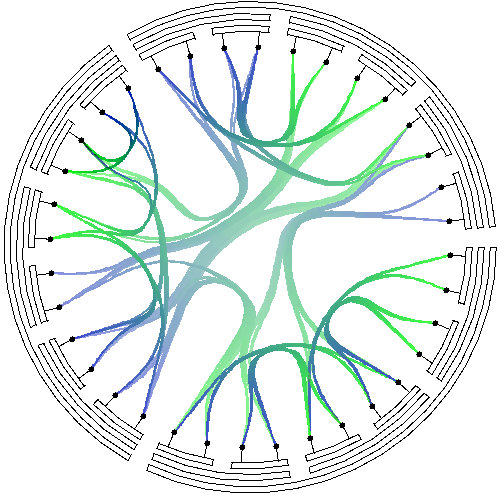
Fig 10. using the inverted radial layout, with different colors
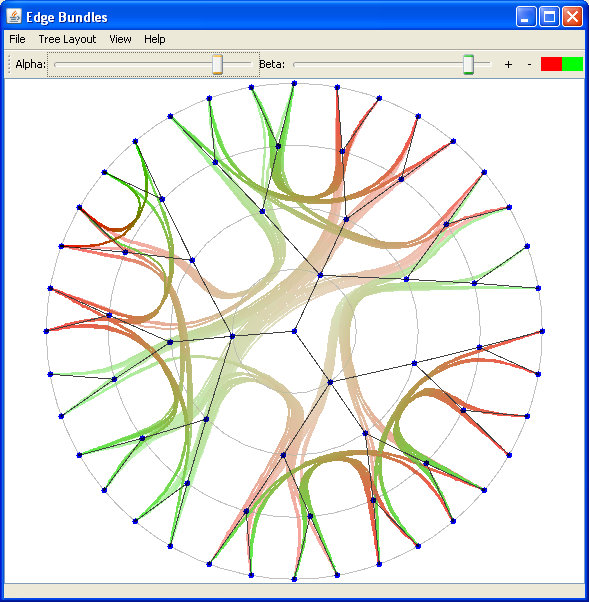
Fig 11. using the radial layout
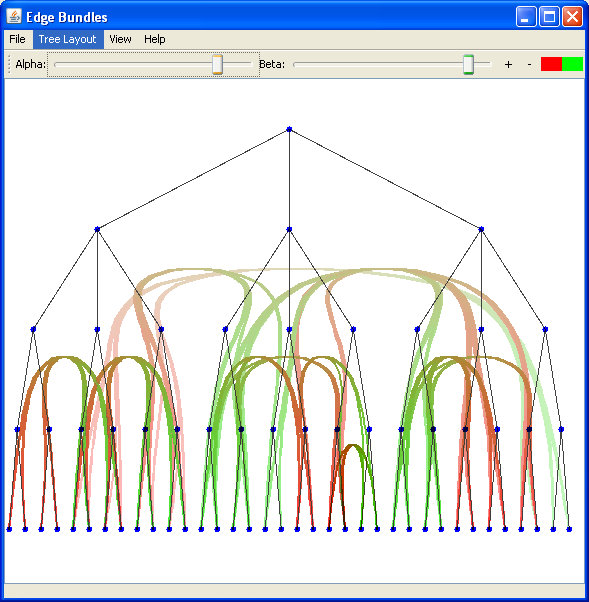
Fig 12. using the rooted tree layout
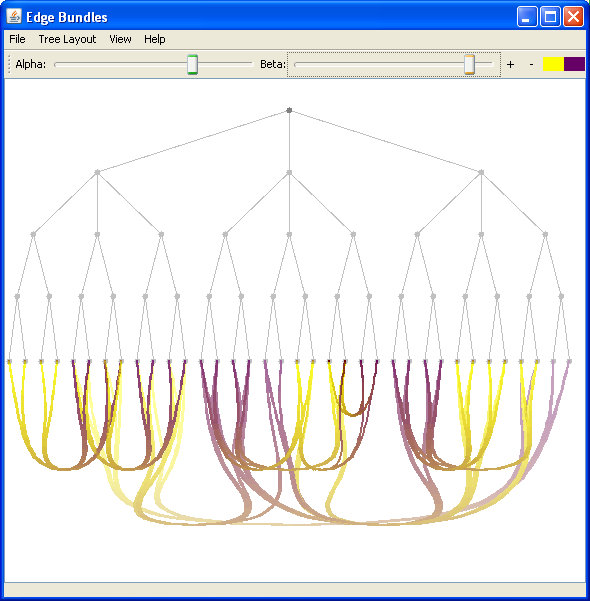
Fig 13. using the inverted rooted tree layout, with multi-component colors.
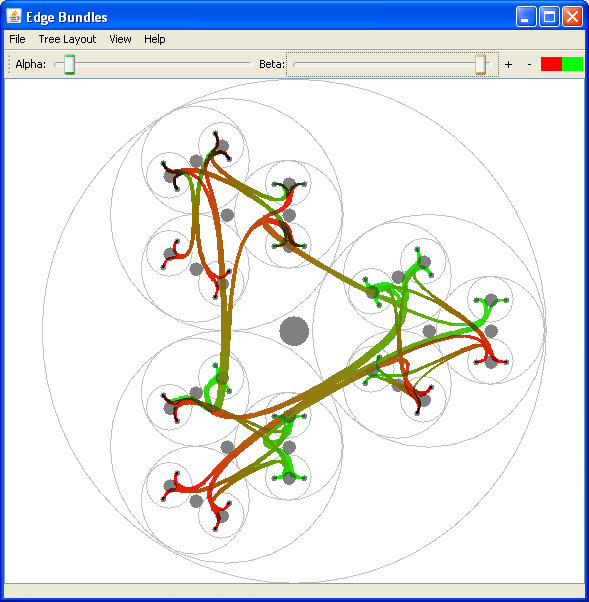
Fig 14. using the balloon layout
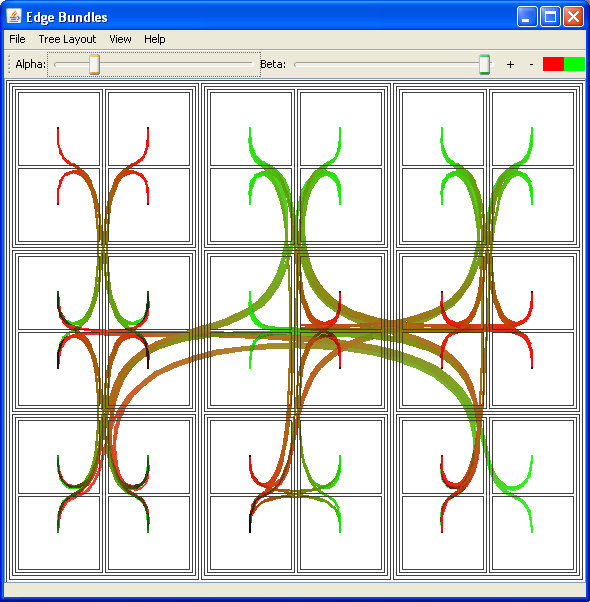
Fig 15. using the treemap layout, not so intuitive...
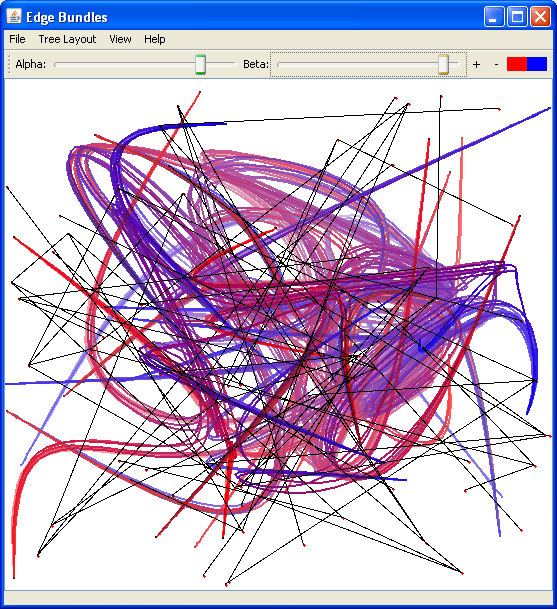
Fig 16. using the random Alsallakh layout :). It shows how important InfoVis is in our life :)
The hierarchical edge bundling is an elaborate technique which helps in visualizing adjacency relations in hierarchical data with less clutter and offers a good grasp of high level information from these relations.
Here you can get the application as a jar file, along with two sample datasets, in .zip format:
To run the application write: java -jar EdgeBundles.jar in your command line.
Here you can get the java source of the application along with documentation and a Borland JBuilder project file: